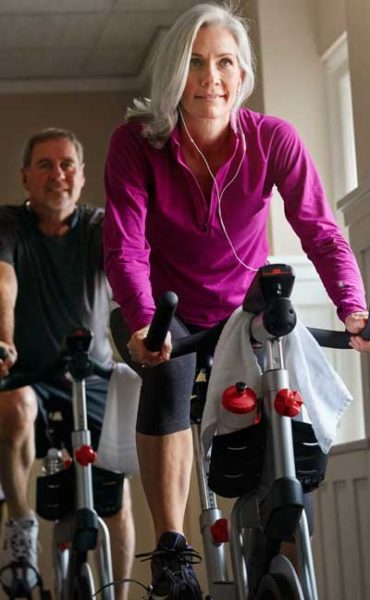
I was 35 years old when I started my adult cycling career. In those early years, my rapidly-growing cycling fitness more than compensated for any loss of overall fitness that came as I aged.

As the years passed, my cycling fitness reached a stable plateau, while the effects of aging slowly but consistently gained momentum. But I wasn’t worried; throughout my forties I could easily keep up with riders ten years younger.

But when I turned 50, I noticed it took increasingly more effort to keep up with the kids. And now that I’m 60 years old, I have to admit that I’m simply not keeping up with them anymore, and never will again, no matter how hard I train.

So in case you’re on that same career path, here’s a few observations about my experience as an aging cyclist.

It’s easiest to see in the numbers. It wasn’t as linear as the “220 minus age” formula implies, but my max heart rate has dropped significantly over the past 15 years, from 175+ down to 160. And the inevitable loss of muscle mass has been reflected in my FTP and other measurements of power output like sprinting duration and max power.

The media always invokes the idea that we need more recovery time after hard efforts as we age. For me, that manifests mostly in my ability to do repeated bursts of high-intensity effort within a ride. I don’t feel I need more recovery time between rides; if I need more time for anything after a hard ride, it’s for my motivation to recover! And of course the standard prescription for maintaining fitness as we age is to continue doing severely painful intensity workouts. Ugh!

One generalization I can confirm is that as I’ve aged, my sleep cycle has become shorter and less refreshing. Gotta start embracing the nap, although they’ve always left me feeling nauseous afterward.

Another change is that I’m less willing to tolerate bad weather. I’m good with heat, but I’m kind of done thinking that riding in the cold is any fun. Doubly so for rain, and the annoying cleanup routine that follows a wet ride. Yes, it can be done; no, I don’t think it’s worth it anymore.

But once you’re out on the road on a nice day, what does riding “over the hill” feel like? It feels like having one of those days where you’re not performing at your best… every single day! Whether it’s heavy legs or lack of aerobic fitness, it always feels as if there’s something limiting me. There aren’t many of those strong days when you’re at peak fitness and everything comes effortlessly.

Instead of looking forward to hills as a place to attack your group, you begin to fear them as places where you’ll fall behind the group. And they drop you more frequently on those climbs… and on the flats… and on descents. You still participate in group rides, but you wind up isolated and riding by yourself much of the time.

You get discouraged on group rides, because you’re the last person to each rest stop, which means you always get the least rest before the group sets out again, despite being the person who needs recovery the most. So you give up on the group and spend more time doing solo rides.

That’s what it’s like. I’ve had an undeniable drop-off in physiological performance due to aging. But at the same time, psychologically I’m just less willing to tolerate the suffering inherent in high-intensity, maximal efforts. To keep up with other riders, I have to spend more and more of my time riding at my limit, and it’s harder and harder to marshal the motivation to spend long hours riding at that limit.

While I was slowly getting older, I spent 25 amazing years near the front of the pack. Now that I’m 60 years old, that’s simply no longer a possibility. It’s time to set ego aside and get used to being one of the slower riders that other people have to wait for. It’s either that, or ride solo, which is something I’ve always done quite a lot of.

While I may not be the strongest cyclist in the pack any more, I still have the advantage of being significantly healthier than my sedentary age-group peers. And I still have as much passion for cycling as I’ve ever had. The bottom line is that I need to accept my reduced capabilities, adjust my goals to match them, find groups that will tolerate them, and just ride on.

May the road before you be a long, enjoyable one!

When a product sucks, I‘ll tell you; and the new revision of the Wahoo TICKR sucks.

For the past two years, I’ve used a first-generation TICKR heart rate monitor chest strap. And it worked flawlessly until the snaps corroded and fell apart at the end of June.

And before that, I used two Garmin HRM straps and then one branded by Bontrager (although I have no idea who actually manufactured it for them). So I’ve had HRMs for around 15 years and know how to care for them and what kind of data to expect.

Shortly before my old TICKR died, Wahoo Fitness had conveniently announced a second-gen version of the TICKR, which I promptly ordered.

That was back in June, and the subsequent two months have been a litany of disappointments. Despite my updating the firmware and other troubleshooting tasks, the data coming out of the new unit was unusably bad, when it produced any data at all.

In feeble hopes that they’d sent me a defective unit, Wahoo shipped me a second unit, which was just as worthless as the first… Then offered me a third.

After giving Wahoo two months and testing multiple devices, I gave up on them and bought an HRM from their competitor Garmin, which was nice, reliable, and accurate straight out of the box.

To give you an idea how bad the new TICKR was, look at the following chart. It shows measured heart rate over the same 5-mile route for those three brand-new HRM straps, alongside estimated power to give you a level of effort to compare against.

Heart Rate Chart

What should you see here? What the Garmin HRM shows: a smooth, undulating curve that responds to and follows the contours of the user's power output, ranging all the way up to the user’s max heart rate.

Instead, both TICKRs spend long periods completely flatlined, when the unit isn’t registering or updating the user’s heart rate, often not responding at all through entire high-intensity efforts. Obviously incorrect, the TICKRs would report a sudden increase in pulse in the middle of a resting period, or a sudden drop in heart rate smack in the middle of a high-intensity interval. And the TICKRs never measured more than 75-85% max heart rate, despite intervals where I put out one-and-a-half times the power of the Garmin run! Hence the unbelievably low average heart rates. Based on my observations, the TICKR has a promising future… not as a heart rate monitor, but as a random number generator!

I saw the same consistent behavior irrespective of which unit I used, and whether I used it outdoors connected to my bike computer or indoors connected through my laptop to Zwift. The only time I was able to get a momentarily reliable reading was if I was sitting up in the saddle, riding no-handed.

Releasing poorly-debugged products has become Wahoo’s claim to fame, due to well-publicized problems they’ve had with their indoor trainers and related accessories, and now something as simple as an HRM strap. The one exception is their well-received line of bike computers, which is in perfect opposition to Garmin, whose recent bike computers (looking at you, Edge 820!) have been terrible.

So while I got great value from my first-gen TICKR, I strongly recommend against the second-gen TICKR. If you want an HRM that works, my endorsement goes to the slightly more expensive (but functional!) Garmin HRM-Dual.

In my previous post, I outlined my plan of using Zwift to mimic real-world rides I had planned but couldn’t ride due to the Coronavirus lockdown. My goal has been to ride the same distance and elevation gain as the actual route.

When my first event came in late April, I somehow had to identify a route on Zwift that would provide me with the same 7,687 feet of climbing over 123.19 miles as the IRL ride. I cobbled together a mash-up of three different routes, but it was a bit off: 8,402 feet of climbing over 125.56 miles! My mileage was good, but I’d done 10 percent more climbing than I needed to!

I knew there was a better way. Someone should write a program that would take stats for all Zwift’s routes and compare that to my target route, then tell me the Zwift route that would allow me to finish with just the right combination of distance and climbing.

Obv, that someone had to be me.

So I went to work and produced the Zenturizer. You give it the distance and climbing in the ride you want to simulate (metric or imperial), and it will list which routes on Zwift are the best match, and how many laps you need to do. Just like this:

Zenturizer main screen

Last weekend, I wanted to test the Zenturizer and get another “Zentury” under my belt. While I didn’t have any real-world events in May, I decided to replicate a ride I used to do over Memorial Day weekend back when I lived in Boston: the Tour d’Essex County, a 102-mile century in Boston’s north shore and Merrimack valley that included 3,000 feet of climbing.

Feeding that data into the Zenturizer produced the following options, in order of how closely they match my criteria:

  1. Ride about 15.9 laps of Flat Route (Watopia) 94% match
  2. Ride about 44.7 laps of Volcano Circuit (Watopia) 88% match
  3. Ride about 44.2 laps of Volcano Circuit CCW (Watopia) 88% match
  4. Ride about 34.8 laps of Classique (London) 83% match
  5. Ride about 16.4 laps of Greater London Flat (London) 83% match
  6. Ride about 6.6 laps of Greatest London Flat (London) 75% match

Although I wasn’t very excited at doing the bog-standard Watopia Flat route, it was the best match, and I wasn't about to ride any course 35-45 times, so Watopia Flat it was!

According to the Zenturizer’s calculations, it should have taken exactly 15 laps of Watopia Flat to accumulate 3,000 feet of climbing, and 15.9 laps to go 102 miles; on my Zwift ride, both those estimates were right on the money!

In an ideal world, I would complete both distance and climbing goals at the same time. But because the closest Zwift course wasn’t a perfect match, I finished my climbing goal a full lap before my mileage goal. In riding that extra lap to complete my mileage goal, I wound up doing an extra 213 feet (or 7 percent) of climbing. However, that actually matches the Zenturizer’s estimate that the Zwift route would only be a 94 percent match for the IRL route.

All told, I think the Zenturizer did a fantastic job finding the right Zwift route to simulate the real-world ride I chose. Feel free to try it out yourself!

Okay, that’s enough about the Zenturizer; how did the ride go?

It was hot. I was hoping to ride Friday or Saturday or Sunday, but I spent those days suffering with a migraine. So Monday it was, and temps inside my pain cave sat at 90º throughout. Being my first hot indoor century, I suffered a lot, but also earned a number of lessons:

  • Have tons of ice on hand. Two trays of cubes isn’t enough!
  • Start early in the day. I got a late start, and it was already hot when I saddled up.
  • In addition to a towel over the handlebars, have a second towel nearby to sop up excess sweat. I normally don’t sweat, but given the conditions...
  • Nothing feels better than a cold, wet facecloth. Lifesaver!
  • Watch out for cardiac drift. As the event wore on, I had to back off markedly because of elevated heart stress. Take it easy; there’s no point in trying to hammer for five hours straight in the heat.

But I knocked it out, thanks to the Zenturizer. And that’s the story of my 5th Zentury of the year!

Obsessive-compulsive here has been logging his blood pressure weekly since 2014. That’s enough data points to provide a reliable test for the conventional belief that regular exercise lowers blood pressure.

An online search yields a common assertion that daily exercise can lower one’s blood pressure by 4-9 mmHg, although references are inconsistent about whether that refers to both both systolic and diastolic BP or just systolic. The effect is greater for people with existing high blood pressure than for those with normal readings.

Although I do try to ride in the winter, my volume of exercise is still far greater in the summer months, so the seasons make a logical way to compare periods of high versus low activity.

So I defined the winter as the six months from November through April, and the summer as May through October. Collating all my weekly observations and calculating the averages produced the following results:

My systolic blood pressure was 3.5 mmHg lower during the summer months, when I was more active.

My diastolic blood pressure was 3.9 mmHg lower in the summer.

My resting pulse (heart rate) was 2.1 beats per minute lower in the summer.

These all conform perfectly with conventional expectations. The magnitude of change is on par with going onto a strictly low-fat diet, losing 10-20 pounds of body weight, or taking a prescribed blood pressure medication.

I know, that’s not an especially interesting result. I guess “science is right again” stories just aren’t very newsworthy.

I’ve wanted a heart rate monitor (HRM) for many, many years. They’ve been the gold standard for cyclist training tools for a long time, notwithstanding the recent trend toward power meters.

However, they’re somewhat expensive, and I never felt justified in spending the money. Plus I feared it would be like the cadence sensor: useful only for a short period of time, enough to calibrate one’s own internal sense, and extreaneous thereafter.

However, prices have come down, and an HRM would have been handy indeed for my wintertime indoor trainer workouts. So I finally picked up a cheap Sigma Sport PC14 on sale at the Noshbar.

Cheap is the word. Any electrical field will cause the unit to either register a pulse of zero or over 200: a near impossibility for someone my age. So I can’t really trust it to record the max heart rate I hit during any given workout. Unfortunately, your max is what all the training heart rate zones are based off, so I’m fiddling with it to find my true max.

Here’s my initial observations. They’re based on only two days’ worth of use, so they’re highly provisional.

heart rate monitor

Resting heart rate, taken before getting out of bed in the morning, is a good indicator of general fitness. A sedentary person might have an RHR in the range of 60-80 beats per minute, while a trained cyclist would be closer to 45-55, so lower is usually better. I’ve seen a low of 51 bpm, and a sustained reading of 53, so that’s in line with my expectations. I remember taking my pulse in high school when I was bored and getting resting rates below 48.

Max heart rate is largely a function of age, and the standard formula for estimating it is to subtract your age from 220, but that will then vary based on your fitness level, with higher numbers being better. A 45 year-old’s expected values range from 164 to 186 bpm, and although I predicted I’d max out at 165, I’ve seen readings as high as 171. That’s in line with the base formula, although again that’s preliminary and more testing is required.

Using that as a base, I derived several additional numbers. My aerobic limit is around 120 bpm (70% MHR), and recovery rides should stay below 140 bpm (80% MHR). My lactate threshold should be somewhere between 140 and 155 (80-90% MHR).

The most interesting thing I’ve learned so far is that you can do easy aerobic training or you can do hard, painful interval training, but you derive very little training benefit in the middle ground between them. Below 70% MHR you’re burning mostly fat and can go all day; above 85% MHR you’re burning glycogen and building up lactic acid and need to rest and recover every few minutes; but in that grey area between 80-85% MHR, you’re working way too hard to burn any fat, but not hard enough to exercise your VO2 and ability to buffer and clear lactic acid. So that’s a dead zone you should avoid training in; for me, that area is from about 137-145 bpm. In short: go easy or go hard, but don’t go halfway.

For anyone trying to lose weight, that information is incredibly important. You’re always drilled with the value of exercise— particularly aerobic exercise—in losing weight, but there’s a huge mental trap there. Although aerobic exercise raises your heart rate, it doesn’t raise it enough for it to feel hard. Since most people think “harder is better”, they’ll often push themselves and work out in this middle ground, where they’re working hard, but not all-out. Unfortunately, at that level you’re only burning glycogen, not fat, and you’ll just crave sugar to replenish your blood and liver glucose levels. To lose weight, you have to do gentle exercise for very long periods of time, and it shouldn’t feel very difficult at all.

It’s similar to one of the problems I observe in novice cyclists. They get on a bike and mash down on the pedals at a knee-shattering 60 rpm. They think you have to work hard to make the bike go, or that you’re not exercising unless it’s hard work. It’s counterintuitive to a new rider, but selecting a very light gear that you can turn over easily is not only less effort and better aerobic exercise, but it’s also more efficient, and will save your knees, which harder efforts will damage.

So that’s the report on this year’s new toy. I’ll be curious to get more data from it over time, and particularly to see whether it provides me with useful information that will help me marshal my physical resources during longer rides.

Frequent topics