Anty Up

Jun. 10th, 2024 02:11 pm

Last year’s 100 km Fire Ant Tour was both my first organized cycling event in Texas, and the first one on my new bike (writeup). And this past weekend it became the first Texas event I’ve repeated for a second time. I approached it with more confidence this year, having already completed my first century a month ago (writeup).

Cruising to a strong finish

Cruising to a strong finish

Line of early starters rolling out

Line of early starters rolling out

All blue sky and sunshine

All blue sky and sunshine

Texas ain't all desert yanno

Texas ain't all desert yanno

Since I normally only do writeups for imperial centuries – and this wasn’t one – I’ll limit myself to some brief highlights.

In an effort to avoid the afternoon heat, this year 230 riders rolled out at 7:15 rather than 8am, which meant I climbed out of bed at 4am and hit the road at 5:15 for the 90-minute drive up to Gatesville. Although it was 23° at the start, a cloudless sky promised a hot pre-solstice afternoon and a strong wind out of the south.

The first 25 km was the same route as last year, but then we veered off for a 45 km out-and-back spur toward Crawford that included 6 km of the worst “paved” surface I’ve ever ridden. After skipping the first two water stops, I pulled in to Stop 3 at 8:35 with 39 km down: more than a third complete!

After taking on some water – and nothing else, due to the disappointing selection – I got back on the road, completed the rest of the outbound leg, and turned around and went back the way I’d come. That rough section wasn’t quite as bad on the way back, but now we were fighting a 20 km/h headwind with 37 km/h gusts. At least the wind provided a little cooling, with the temperature now above 30°. I rolled into the next stop at Osage at 10am, with my GPS reading 71 km: two-thirds down!

With the heat, a headwind, tiring legs, and my hands and back aching from the rough roads, I split the final third into two legs. The remaining 30 km returned to roads from last year’s route, which included a very hard hill just before the final rest stop, where I arrived at 10:55am, with 87 km done.

After a bit of rest, I nursed it home, finishing 100 km with 636 meters of climbing at 11:30am. I was wiped, but nowhere near as devastated as last year, thanks in part to the earlier start allowing me to avoid the noonday heat by climbing off the bike 90 minutes earlier. I picked up my finisher’s medal, rested in the air conditioned civic center, and used a wet facecloth to wash off the layers of sunblock, sweat, road grime, bugs, and Gatorade (my bad: doused myself with the wrong bottle!) that had accumulated on my arms and legs.

Since event rides have been rare, it’s worth closing with some general reflections.

I was interested in my GPS’ estimation of my stamina remaining, which even at the end said my legs had another 90 km in them. Which is nice, but color me a bit skeptical on that point.

I even more closely watched my power numbers for each segment. I’m trying to be more aware and structured about not starting out too hard, and this provided some good data, as my average wattage dropped from 151 to 137, 127, and finally 97 on the final leg.

Equipment changes included ingesting electrolyte pills (the jury’s still out, but it can’t hurt), bringing a post-ride sweat towel (good idea), and my tire jack (wasn’t needed, but gave peace of mind). I chose not to bring my HoverAir X1 selfie drone, which isn’t really ideal to carry and deploy in the middle of a large event.

But overall, this year’s Fire Ant Tour was pretty satisfying. Now that I feel more comfortable with my new bike and riding in Texas, a hundred kilometers doesn’t feel like the major milestone it was at this time last year. But it was an enjoyable day in the saddle out in the wide-open farmland of Central Texas. And there won’t be many of these long organized events over the coming summer months.

Plus this was good training for my remote PMC charity ride, which is less than eight weeks away. I’d really love to have your support in raising money to eradicate cancer in this, my 18th Pan-Mass Challenge.

I was 35 years old when I started my adult cycling career. In those early years, my rapidly-growing cycling fitness more than compensated for any loss of overall fitness that came as I aged.

As the years passed, my cycling fitness reached a stable plateau, while the effects of aging slowly but consistently gained momentum. But I wasn’t worried; throughout my forties I could easily keep up with riders ten years younger.

But when I turned 50, I noticed it took increasingly more effort to keep up with the kids. And now that I’m 60 years old, I have to admit that I’m simply not keeping up with them anymore, and never will again, no matter how hard I train.

So in case you’re on that same career path, here’s a few observations about my experience as an aging cyclist.

It’s easiest to see in the numbers. It wasn’t as linear as the “220 minus age” formula implies, but my max heart rate has dropped significantly over the past 15 years, from 175+ down to 160. And the inevitable loss of muscle mass has been reflected in my FTP and other measurements of power output like sprinting duration and max power.

The media always invokes the idea that we need more recovery time after hard efforts as we age. For me, that manifests mostly in my ability to do repeated bursts of high-intensity effort within a ride. I don’t feel I need more recovery time between rides; if I need more time for anything after a hard ride, it’s for my motivation to recover! And of course the standard prescription for maintaining fitness as we age is to continue doing severely painful intensity workouts. Ugh!

One generalization I can confirm is that as I’ve aged, my sleep cycle has become shorter and less refreshing. Gotta start embracing the nap, although they’ve always left me feeling nauseous afterward.

Another change is that I’m less willing to tolerate bad weather. I’m good with heat, but I’m kind of done thinking that riding in the cold is any fun. Doubly so for rain, and the annoying cleanup routine that follows a wet ride. Yes, it can be done; no, I don’t think it’s worth it anymore.

But once you’re out on the road on a nice day, what does riding “over the hill” feel like? It feels like having one of those days where you’re not performing at your best… every single day! Whether it’s heavy legs or lack of aerobic fitness, it always feels as if there’s something limiting me. There aren’t many of those strong days when you’re at peak fitness and everything comes effortlessly.

Instead of looking forward to hills as a place to attack your group, you begin to fear them as places where you’ll fall behind the group. And they drop you more frequently on those climbs… and on the flats… and on descents. You still participate in group rides, but you wind up isolated and riding by yourself much of the time.

You get discouraged on group rides, because you’re the last person to each rest stop, which means you always get the least rest before the group sets out again, despite being the person who needs recovery the most. So you give up on the group and spend more time doing solo rides.

That’s what it’s like. I’ve had an undeniable drop-off in physiological performance due to aging. But at the same time, psychologically I’m just less willing to tolerate the suffering inherent in high-intensity, maximal efforts. To keep up with other riders, I have to spend more and more of my time riding at my limit, and it’s harder and harder to marshal the motivation to spend long hours riding at that limit.

While I was slowly getting older, I spent 25 amazing years near the front of the pack. Now that I’m 60 years old, that’s simply no longer a possibility. It’s time to set ego aside and get used to being one of the slower riders that other people have to wait for. It’s either that, or ride solo, which is something I’ve always done quite a lot of.

While I may not be the strongest cyclist in the pack any more, I still have the advantage of being significantly healthier than my sedentary age-group peers. And I still have as much passion for cycling as I’ve ever had. The bottom line is that I need to accept my reduced capabilities, adjust my goals to match them, find groups that will tolerate them, and just ride on.

May the road before you be a long, enjoyable one!

Measuring power is the gold standard of performance management on the bike. I’ve waited years for the industry to provide a pedal-based power meter that is accurate, uses mountain bike-style SPD cleats, is reasonably easy to use, and “affordable”.

In 2018 I bought a Wahoo Kickr Core indoor trainer, which allowed me to finally measure my power output over the winter. But when I took the bike off the trainer for the summer, I had to give up measuring power, and go back to estimating power (and thus fitness and fatigue) indirectly based on heart rate data.

Garmin Rally XC200 power meter pedals

However, after over a decade of waiting, last month I opened my wallet and acquired a set of Garmin Rally XC200 power meter pedals. Here’s some background and insight into how it’s been for me so far…

Why pedal-based? These days, you can throw a power meter on a bike in several places: pedals, crankarms, chainring spider, rear hub… A pedal-based system made sense for me because it’s the easiest to install, and the easiest to move from one bike to another. And unlike a hub or indoor trainer, it measures your power output earlier in the process, because some power is lost to friction and inefficiency in the drive train (as we’ll see in detail below).

Why the Garmin ones? One other option, the SRM X-Power, was about the same price, but they have a bad rep with pedals, and just didn’t seem able to manufacture them very quickly.

The only other option would be to buy a pair of non-SPD Favero Assioma pedals, rip out the internals, and plug that into a pair of Favero SPD pedal bodies. That would have been a couple hundred bucks cheaper, but would have voided their warranty, which is meaningful on a nearly $1,000 purchase.

Another argument in favor of the Garmins is that they have 2 to 4 times better battery life than the others.

A lot of this gets covered in exhaustive detail by the incomparable DC Rainmaker in his exhaustive Garmin Rally review from last year, as well as this year’s power meter pedal buyer’s guide.

Some miscellaneous notes: All these pedal-based units are double-sided (a necessary convenience), and also transmit your cadence to your bike computer, eliminating the need for a separate cadence monitor.

Like the Assiomas, the Garmin power meter is housed in the pedal spindle, and can be moved between pedal bodies of different styles. So if I ever decided to switch from SPD pedals to SPD-SL or Look Keo style cleats, I could just buy some empty pedal bodies and plug the power meter spindle right in.

Also, although the Garmins were very expensive, I got a tasty $240 discount thanks to REI’s spring members’ sale. Plus forthcoming reward bucks that could be applied to a new Garmin bike computer, if they were to ever release a new model…

Some usage notes: You need to keep a couple things in mind in addition to your battery life. One is that you need to let the unit acclimate to the outdoor temperature in order to get accurate readings, and that can take about ten minutes if you store and ride your bike in very different temperatures. And then you also need to do a zero-offset calibration about 10 or 15 minutes into every ride. It’s a bit of a bother, but it’s much better than we used to do with older power meters.

One big difference is the weight of the pedals. These pedals weigh 443g; they are replacing my current pedals, which weigh in at 306g. Although I’ll also be removing my dedicated cadence sensor from the bike, which is an additional 10g.

So what data do I get? I’ve already mentioned power (in Watts) and cadence, but there’s a shitton more. You get the power balance between your left and right legs. You get how much time you rode seated versus standing. You get measurements of how much power you produce at all points throughout the pedaling circle (even if that’s not of any practical value to anyone). You get measurements of whether your power is being delivered at the center of the pedal, or off to one side, which might indicate a bit of a fitting problem. And all of these are logged second-by-second for later analysis.

Can this get any geekier? I’m glad you asked!

So one of the biggest questions to ask of any power meter is its accuracy. The first units claimed to be accurate to ±5%, and up til now I’ve been assuming my Kickr is performing up to its ±2% claim. Most power meters these days (including my pedals) advertise ±1% accuracy, but how do I know? Well, let’s compare them against one another!

I’m going to look at two indoor trainer rides. The first is a March 31th 50-minute ride of Zwift’s Tour of Watopia Stage 3 on the hilly Downtown Titans route. The second, longer ride is ToW Stage 2’s flatter Watopia’s Waistband route on April 2th.

For each ride, I simultaneously recorded the power data coming from my Wahoo Kickr Core, and also that coming from my Garmin Rally XC200 pedals. So if things are working correctly, the measurements coming from each ride should be almost identical.

First, the numbers: As expected, cadence was virtually identical between the pedals and the crank-mounted dedicated cadence sensor (I did not take cadence from the Kickr, as trainers aren’t reliable for cadence data).

In contrast, the pedals registered an average power that was 2.7 to 4.1% higher than the trainer. Similarly, average weighted power came in 3.0 to 4.5% higher. Does that mean one power meter is slightly off, and how do we know which one?

No, everything’s fine. That small difference is eminently explainable by that thing I mentioned way back in paragraph four: power numbers coming from a trainer will be lower due to drive train losses that occur due to friction and flexion somewhere between the pedals, crankarms, chainrings, chain, cogset, and trainer. So they’ll naturally report a little lower numbers than pedals, which measure power transfer much earlier in the process. That would easily explain the 2.7 to 4.5% variation I saw.

But interestingly, when you look at maximum power (e.g. sprinting), the difference between the pedals and trainer falls to 0.6 to 1.0%. I haven’t got a good explanation for that yet.

But that’s all just summary data, and averages aren’t a great way to validate data over time. Much more revealing (and interesting) is the second-by-second detailed data. For that, we need some charts!

Next, the charts: So let’s compare the power data for each ride in the DC Rainmaker Analyzer Tool, overlaying the numbers for each ride from our two data sources to see how closely they match up. In all these charts, the red line is my Kickr Core trainer’s data, and the Garmin pedals are in green, and hopefully those lines will be almost identical.

First, let’s look at the power charts for the whole duration of both rides.

Chart: 3/31 power over 50 minutes Chart: 4/2 power over 90 minutes

It’s a little easier to see on the first chart, since it’s less busy, but in general the numbers reported by my pedals and my trainer line up really well, with the pedals giving slightly higher numbers, as expected.

Remember tho that the first chart is 50 minutes long, and the second is 90 minutes. So although things look pretty good (yay!), this is at an extremely coarse level. For a better comparison, we really need to zoom in a little closer. Let’s find a couple representative chunks in the 7- to 10-minute range.

Chart: 3/31 power over 7 minutes Chart: 4/2 power over 10 minutes

And there you go. Aside from the pedals’ slightly higher readings, the ups and downs of the charts are almost identical, close enough that the difference could easily be put down by the devices’ different sampling rates. No dropouts, no crazy spikes, or big differences between the curves.

In addition to a simple time-series comparison, there’s another way athletes look at power that might confirm our conclusion. For a sprinter, your overall power doesn’t matter so much as the maximum power you can put out and sustain over five, ten, maybe thirty seconds. So the critical power curve shows the maximum power you sustained over a particular duration. Obviously, the human body can generate a lot of power in short bursts, but can only sustain a more moderate power over durations measured in minutes and hours.

Unfortunately, as I’ve noted before, I’m keeping an eye on some cardiac issues and my chainrings are so worn that I can’t really sprint without dropping my chain, so my numbers are very pedestrian. Still, we can still draw some conclusions from my critical power curves for those two rides.

Chart: 3/31 critical power Chart: 4/2 critical power

And this perfectly confirms everything we’ve seen so far. At just about every duration, the pedals consistently read 3 to 5% higher than the trainer, as expected. The only variance is at durations shorter than 15 seconds, where the devices’ sampling rates might impact the numbers.

So my overall conclusion is that I can definitely rely on these pedals to produce accurate power data that is very consistent with my indoor trainer, keeping drive train losses in mind.

Unless you’re a cyclist, it’s hard to convey how exciting and interesting it is to finally have a power meter on the bike year-round. At the big-picture level, this means my power data will finally be consistent between indoor and outdoor seasons, thus giving me more reliable fitness and fatigue numbers.

This means I can not only monitor my fitness and fatigue month-by-month and year-over-year, but also precisely quantify and properly pace my level of effort and reserves on a minute-by-minute basis during an individual ride of whatever duration.

One of the most popular ways of measuring a cyclist's performance on flat terrain is functional threshold power, and Zwift provides riders with three different FTP tests. My FTP is generally around 210-230 watts.

But for those of us who aren’t afraid of hills, the best measure of climbing performance is one's time to climb the Alpe du Zwift, the virtual equivalent of France’s famous Alpe d’Huez. There’s even a highly sought-after “Liftoff” achievement badge for doing the 7.6-mile 3,400-foot climb in under an hour.

While I haven’t been able to break that barrier, I have done 30 ascents, which is enough data for me to draw some inferences. Since my average power on those attempts has varied from 162 to 234 watts, my times have also ranged from from 88 minutes to just under 63 minutes.

Now things start getting really geeky. You have been warned.

You would expect that if I plunked those numbers down on a scatter chart, there’d be a clear relationship between average power and time. And that’s exactly what I found. Then I added a statistical trendline, which matched my data points shockingly well (an r-square of 0.98 for the statisticians in the audience).

Now here’s where it starts getting interesting. Using that line, for any given average power, we can predict — with near-perfect precision — how long the climb would take me. Specifically, my (slightly simplified) equation is:

minutes = (watts - 400) / -2.76

So putting out 200W, I would finish in 73:13. At 220W, I would finish about seven minutes faster, at 65:58. And in fact we see clusters of past results right around those points.

Whether you use the equation or eyeball the trendline, that calculation also works in reverse, starting with a finish time and seeing what power you’d need to hold. So in order to earn the Liftoff badge by doing the ascent within 60 minutes, I would need to maintain an average power of 236.5 watts for an hour.

This does ignore the second variable that determines one’s ascending speed: weight. Conveniently, my weight doesn’t fluctuate much at all, so I can safely ignore it. But someone else with a different weight would have a somewhat different equation.

That’s why climbers focus on power over weight rather than raw power. Their preferred metric is watts per kilogram, or W/kg. If I re-did this chart using W/kg, it should be an even closer fit.

Among riders chasing the Liftoff badge there’s a common shared belief that you have to maintain 3.1 W/kg in order to climb the Alpe in less than an hour. Now we can put that idea to the mathematical test.

My equation says I would need to put out 236.5W. In order for that to equate to 3.1 W/kg, I would have to weigh 76.3kg. Lo and behold, that’s smack in the middle of my normal weight range, and within two pounds of my current weight. So that validates both my trendline equation as well as the common rumor.

To repeat: to climb the Alpe in an hour at my current weight, I’d have to produce 236W. However, my maximum sustainable power has stayed firmly in the 210-230W range. Alternately, rather than increasing my power output I could lose weight and still hit 3.1 W/kg. At 230W, I would have to get down to 164 pounds, which is pretty extreme for me.

After 30 attempts — and approaching 60 years of age — I won’t be disappointed if I never earn that Liftoff badge. But I enjoy analyzing my performances over time and finding the patterns of consistency that underlie them.

What a year it was... or wasn’t, actually. What can I say about the 2020 cycling experience?

Having begun the year with lots of indoor training, in January I achieved a new all-time record level of fitness.

Modeling the 2020 Pan-Mass Challenge jersey on the Grandview Overlook above downtown Pittsburgh

Modeling the 2020 Pan-Mass Challenge jersey on the Grandview Overlook above downtown Pittsburgh

Autumn on the Mon Wharf with R2-Di2

Autumn on the Mon Wharf with R2-Di2

Honoring Paris-Roubaix with 22 secteurs of Pittsburgh pavé, including Climax Street

Honoring Paris-Roubaix with 22 secteurs of Pittsburgh pavé, including Climax Street

Flew my BikeMS kit on my virtual Escape to the Lake

Flew my BikeMS kit on my virtual Escape to the Lake

At the front of the line for the first-ever PMC weekend virtual ride on Zwift

At the front of the line for the first-ever PMC weekend virtual ride on Zwift

But it was all downhill from there. Before the spring outdoor season began, the outbreak of the worldwide Covid-19 pandemic caused the cancellation of all group rides and every major event on the calendar. On top of that, I kept my solo rides short to avoid risky convenience store replenishment stops. In terms of outdoor riding, 2020 was a complete and utter write-off, as I logged a 20-year low 1,140 outdoor miles.

In contrast, my investment (back in 2018) in a new smart trainer and the Zwift indoor training platform proved prescient and timely. Over 80 percent of my 2020 cycling happened indoors, as I rode simulated versions of all my usual summer events. I even completed my 15th Pan-Mass Challenge (virtually) when this year’s real-world ride was called off. Needless to say, my 4,903 miles on the trainer was a new record.

Combining indoor and outdoor riding gave me an annual total of 6,043 miles in the saddle, only 513 miles less than I rode in 2019. I consider that quite respectable, given the extraordinary circumstances.

Let’s hope 2021 sees the pandemic situation improve.

My Original 2020 Goals

After a superlative 2019, I didn’t have a ton of specific goals coming into the 2020 season, which was a good thing, because I never would have lived up to them! But I did have some general expectations. Let’s see how each of those turned out...

“I don’t really expect to surpass my 2019 season”

The Covid-19 lockdown put an early end to any pretense that 2020 would be a good — or even normal — year. I didn’t do any major events or even a single group ride all year, and only one outdoor ride that was over 40 miles.

The only way I surpassed 2019 was in time spent on the indoor trainer, completing eleven Zenturies (indoor rides over 100 miles). But that’s not how I’d envision a successful year.

“I’ll certainly continue Zwifting”

I’m not going to enumerate all this year’s Zwift achievements, but there are a handful worth calling out. I completed every one of Zwift’s many routes in January, along the way earning the “Masochist” badge for completing my 25th Alpe du Zwift ascent. But to retain that “route hero” status, I had to subsequently complete two more sets of routes when Zwift released expansions for Paris/France and Watopia. I also took three series of FTP tests, registering 215/215/196W in the 20-minute tests; unlocked the new in-game version of the Herd team jersey; and I ended the year at experience level 44 (out of 50).

I also wrote a useful program for myself to automatically open a full-screen display of any “photos” I took while in-game. That way I didn’t have to wait until the end of the ride to see how they came out, nor did I have to fiddle with the laptop to open them myself.

The Herd’s Epic Tour in Toronto

Another big disappointment was the cancellation of a planned September trip to Canada to do a (nominally) epic ride and meet up with online friends from the Zwifting club The Herd. I never even received the (personalized!) ride jersey I ordered.

Charts

As always, my two fitness charts really put the year’s efforts into perspective.

Cycling Fitness: 2011-2020

This chart shows my fitness trend over the past ten years, with peaks in the summer and troughs in the winter. Looking at 2020 in this context, the major themes I’d like to call out are:

  • My fitness peaked incredibly early in the year (January 26th).
  • I set a new all-time record fitness level (98.18).
  • After coming off that peak, I spent most of the summer at a moderate fitness level (around 65) before taking it easy at the end of the year.

If we set aside comparisons to 2019, I had a surprisingly good year from a fitness standpoint; despite the pandemic, it doesn’t look grossly different from any normal year. And looking forward, I’m in a decent position to make the most of whatever 2021 offers.

Cycling Fitness: 2020 Calendar Year (vs. average)

This second chart shows my 2020 fitness in detail, including my eleven Zentury rides (the green circles).

Note my record fitness peak in January, and how much fitter I was than my long-term average (the grey line) all spring long. Despite that, I did gradually lose fitness through the spring, with it slowly falling to match my long-term average at the start of summer in late June.

Similar to most normal years, my summer featured a familiar shark-tooth pattern that comes from periods of alternating rest and recovery with big hundred-mile rides… It’s just that they all took place indoors this year, rather than outside.

A late September interruption caused my fitness to start falling off, when both my heart rate monitor and the laptop computer I ran Zwift on failed and needed to be replaced. At that point, I reconsidered my goals, and decided to abort my last two century ride simulations and start my off-season a little early. Taking some time to relax, my fitness gradually fell to an annual low of 43.53 on December 7th before I started ramping back up again. Looking forward hopefully toward 2021, I finished the year well ahead of my typical level of fitness.

Waving to imaginary crowds as I arrived at a virtual Provincetown to complete my two-day PMC Zwift ride

Waving to imaginary crowds as I arrived at a virtual Provincetown to complete my two-day PMC Zwift ride

Taking my laps on the Champs-Elysees in Zwift's new Paris/France expansion

Taking my laps on the Champs-Elysees in Zwift's new Paris/France expansion

Enjoying the French countryside, with Mont Saint-Michel as backdrop

Enjoying the French countryside, with Mont Saint-Michel as backdrop

Giving the crowd a sprint to cheer for in Zwift's Crit City expansion

Giving the crowd a sprint to cheer for in Zwift's Crit City expansion

Exploring Zwift's pretty new sylvan cliffside road

Exploring Zwift's pretty new sylvan cliffside road

In group rides, I swear sometimes it feels like I'm the only one who knows how to ride properly...

In group rides, I swear sometimes it feels like I'm the only one who knows how to ride properly...

A rare outdoor ride: autumn at McCahill Park in Fox Chapel

A rare outdoor ride: autumn at McCahill Park in Fox Chapel

Sprinting for the line on Zwift's new Crit City course

Sprinting for the line on Zwift's new Crit City course

When in Italy...

When in Italy...

Looking back on downtown Pittsburgh from Herrs Island

Looking back on downtown Pittsburgh from Herrs Island

My 2020 Cycling Calendar

My 2020 Cycling Calendar

The Zenturies

For the first time since 2001, I didn’t do a single century ride.

But I did complete eleven indoor Zwift centuries, or “Zenturies”, simulating both the distance and amount of climbing found in my usual real-world rides.

How did I simulate them? I created a web page called The Zenturizer where I could input my preferred distance and climbing, and the site would determine the courses on Zwift that most closely matched my desired profile. It was a very handy time-saving tool, which anyone can use!

I had targeted thirteen Zenturies for 2020, but after completing eleven, I took a three-week break to replace both my heart rate monitor and my laptop. At that point I decided to end my season early and save those two extra centuries for springtime. More about that when I get to my 2021 goals!

Here’s the list of the eleven that I did complete:

  • Uber Pretzel Zentury (Feb 13) The penultimate course to ride in my quest to acquire the badges for completing every Zwift route.
  • PRL Full Zentury (Feb 20) Rode a very repetitive course all alone, but completed Zwift’s route badge challenge… for the time being!
  • Tour of Watopia Stage 1 Zentury (Mar 30) Did Zwift’s ToW Stage 1 three separate times in one day to accrue 100 total miles.
  • Pseudo Greenville 200k (Apr 19) My first time cobbling together a route on Zwift that simulated an actual outdoor ride, and at 125 miles my longest single ride of the year.
  • Pseudo Tour d’Essex County Zentury (May 25) Since May is devoid of big events in Pittsburgh, I simulated this Memorial Day ride I used to do back in Boston!
  • Pseudo Escape to the Lake Zentury (Jun 6 & 7) Simulated my annual MS Ride: usually the only two-day ride on my calendar.
  • Pseudo 3-State Zentury (Jun 28) Although this event was postponed and eventually run informally later in the year, I simulated it on its original planned date.
  • Pseudo ABC Zentury (Jul 12) Also informally run as an unsupported ride, I just did this Akron event virtually.
  • Pseudo Pan-Mass Challenge (Aug 1 & 2) Surprise! My 15th Pan-Mass Challenge ride to fight cancer! Participating in my signature event once more as a virtual rider was a treat!
  • Pseudo Mon Valley Century (Aug 18) This “annual” ride has only gone off two of the past five years. At least my Zwift simulation avoided the MVC’s curse!
  • Pseudo City Century (Sep 2) The local advocacy group pretended to sort-of run this unsupported, so that they could still collect money. Fed up with an organization that’s completely lost the plot, I was happy to do my own (free) substitute ride on Zwift.

Additional Highlights

After five years away from the event, reconnecting with the Pan-Mass Challenge was my biggest unexpected pleasure of the year. I was the first person to join the PMC club on Strava; I participated in prototype PMC meetups on Zwift that led to an official weekly series of PMC virtual group rides; I registered as a virtual PMC rider for the first time; and I simulated the entire two-day, 192-mile route indoors on PMC weekend. Along the way, I made a bunch of new friends, did a lot of reminiscing, earned my 15th PMC rider’s jersey, and added $3,000 to my lifetime fundraising for the Dana-Farber Cancer Institute, which now stands at $114,222. Here’s my full PMC ride report.

Although the year featured many other memorable Zwift rides, one of the unique ones was participating in a 2,000-person ride led by Watanabe Wataru, the mangaka who created Yowamushi Pedal, an extremely popular cycling manga and anime series.

I should also add that in October I marked the 20th anniversary of purchasing the Cycles Devinci hybrid that started me on the path to becoming a PMC rider and serious cyclist. It’s been a good — but extremely long — road!

Noteworthy Purchases

This wasn’t a great year for pimping my ride, but a few items do stand out as worth mentioning:

  • When my old laptop died, I replaced it with a new Macbook Pro, which improved my Zwifting experience by upping both my graphics quality and frame rate.
  • I bought a hydration pack, in hopes that it would enable me to do long rides without having to replenish fluids at convenience stores, but it just didn't keep drinks cold enough to be palatable.
  • I bought a new Wahoo heart rate monitor that produced unacceptably inaccurate data, so I got a warranty replacement unit. However, the second unit was also garbage, so I demanded a refund and bought myself a new Garmin HRM instead. But amusingly, a late-year firmware update seems to have fixed the Wahoo HRM’s problem, so I’ve held onto the one unit that they told me to keep rather than return!
  • I bought a collapsable selfie stick and fashioned a nice rubberized frame mount for it, making it much easier to get interesting photos during rides for my Strava and social media posts.
  • And I added the Wind & Rain app to my Garmin bike computer. The real-time weather data it provides would be really useful if I ever actually did any long outdoor rides...

List of Blogposts

It wasn’t the best year for blogging — how much can you write of interest about indoor rides? — but I still managed to get 16 stories written. Here‘s the full list:

Goals for 2021

Even after writing off the entire 2020 season, Covid-19 shows no signs of abating anytime soon, so I still have no idea what 2021 will look like. But everyone’s top goal for next year is obvious:

Normality

How about a return to normality? Being able to ride farther outdoors than I can manage on a single water bottle? Participating in group rides with other cyclists? Or even do some centuries and my typical big events? Right now, that sounds pretty aspirational and more than adequate.

My 100th Century+ Ride

As far as I can tell from my sketchy records from 2000-2005, I’m currently sitting on a lifetime total of 97 rides of 100 miles or greater. I’ll probably get in shape with a couple indoor Zenturies in the spring, then find some way to do a special 100th century outdoors. It’s probably the biggest thing I’m anticipating and a milestone well worth celebrating. Planning out a route will be a good wintertime activity...

Zwift Level 50

In about 3,575 trainer miles — which is currently estimated to happen around August 13 — I will hit Zwift’s highest XP level. There’s a nontrivial possibility that they’ll soon add more levels beyond 50, but that won’t dilute my satisfaction at reaching what’s currently the top of the chart.

Another Virtual PMC?

At this time, I have no idea whether 2021 will see me doing another virtual Pan-Mass Challenge or not, especially since my fundraising mojo has atrophied. But that’s another decision I’ll make as the season begins to take shape.

Toronto Epic Tour Redux?

It’s the same story for this ride. Since they deferred my paid 2020 registration until 2021, I’d certainly like to take advantage of the opportunity to ride, but whether it’ll happen or not remains unknowable.

And that’s all I’ve got to say about this pandemic-canceled 2020 season. As of the start of the new year, things are still looking quite iffy. But as the calendar turns over to 2021, I’m hopeful that some signs of normality will begin to appear in the coming months.

Hopefully I’ll see you out there!

In contrast with a miserable 2018, 2019 was a complete renewal: possibly my best remaining year on the bike, and arguably the best of my entire lifetime.

MS Escape to the Lake Finisher

MS Escape to the Lake Finisher

Indoor Training on Zwift

Indoor Training on Zwift

MS Escape to the Lake

MS Escape to the Lake

Brilliant Physical Health!

I’m in Brilliant Physical Health!

PedalPGH Pittsburgh Overlook

PedalPGH Pittsburgh Overlook

The Herd's Leelanau Harvest Tour

The Herd's Leelanau Harvest Tour

Akron Bike Club's ABC Ride

Akron Bike Club's ABC Ride

My 2019 Cycling Calendar

My 2019 Cycling Calendar

While it lacked crowning moments like the Pan-Mass Challenge or the Dirty Dozen, I set dramatic new high water marks for miles ridden, century rides completed, and level of fitness.

Beyond the numbers, though, was how easy it felt. After my first winter using a smart trainer and Zwift, I began the season already near peak form. It was such a different feeling, without the usual early-season suffering to build fitness, and I went into every major event strong, confident, and at ease.

It made setting and chasing my cycling goals an unblemished pleasure, making 2019 a complete reversal of my disappointment in 2018. It was an absolutely stellar year!

My Original 2019 Goals

Let’s review my 2019 season goals. A year ago, I set three secondary and three primary ones.

My secondary goals laid the groundwork for achieving my primary goals.

My secondary goals for 2019: spending the winter riding Zwift on the trainer, allowing me to enter the road season at a high level of fitness, and monitoring that by performing regular FTP tests throughout the year.”
Spending the winter riding Zwift on the trainer

I really enjoyed Zwift, as described in my summary blogpost. The virtual world was entertaining, the smart trainer changing resistance to simulate climbing kept it interesting, and the social interaction through Discord audio chat was engaging. From December through the spring, I tallied an unprecedented 2,600 simulated miles on the trainer.

Allowing me to enter the road season at a high level of fitness

I monitored my training using my usual fitness charts, which you’ll see shortly. I made steady progress throughout the winter, but would it improve my outdoor riding?

The big test of Zwift’s effectiveness came on April 14th, when one of my first outdoor rides of the year was a 125-mile 200k brevet. It went fabulously, as described in my blogpost.

Performing regular FTP tests throughout the year.

Since my indoor trainer includes a power meter, I can gauge my fitness with a new metric: functional threshold power (FTP). I took two different FTP tests every three months to monitor and quantify my progress, plus automatic FTP increases detected by Zwift while riding. Depending on how you measure it, my FTP varied from 197 to 234 watts, averaging 215W.

That set me up for success reaching my main goals for the year.

My primary goals for next year are simply this: to finally get beyond the malaise of 2018, to ride more, and get back to peak fitness this summer.”
Get beyond the malaise of 2018

Although the turnaround started with my new indoor trainer and Zwift membership, several other factors helped rekindle my desire to ride. Bypassing the usual springtime pain of riding my way into fitness certainly helped. I also lost less time to traveling. And after suffering through 2018 being the rainiest year in Pittsburgh’s history, all of this year’s major rides had gorgeous conditions (despite 2019 being our third wettest year ever). And by staying on top of my fitness and fatigue levels, I avoided overtraining, which can also sap motivation.

Ride more

In 2019 I rode 3,400 miles, which is more than I average, and 625 more than I rode in 2018. So you can check that goal off.

But that’s only 52% of the story... The other 48% are the virtual miles I put in on the trainer. In my first full calendar year on Zwift, I logged an additional 3,182 indoor miles.

My combined total was 6,582 miles, which constitutes an all-time record for me. Ride more? Double check!

Get back to peak fitness

All that indoor and outdoor riding ensured that I got back to peak fitness. I was in the best form of my life, which I’ll quantify in the two charts in the following section.

Charts

These charts provide the next level of detail about my year, plotting my Chronic Training Load (CTL), which is a measurement of cycling fitness. The charts really tell the story for 2019.

Before addressing 2019 in detail, it’s worth looking at my fitness over the past nine years, which allows me to visually compare 2019 to previous seasons.

2011-2019 Fitness Chart

At a high level, four major themes jump out of this chart:

  • I was much fitter than usual earlier in the year
  • My training was much more consistent in 2019
  • I peaked higher, reaching new record levels of fitness
  • I spent a much longer duration at peak form.

If you compare 2019 to 2018, it’s obvious that 2018 was a substandard year, and that 2019 was an immense improvement. My max fitness in 2018 was 66.3; in 2019 I spent six and a half months above that level, peaking in June at 94.3! And looking forward, I’ll begin January 2020 with a CTL of 79: higher than I ever reached in all of 2018!

A little further back, my previous all-time max fitness levels occurred briefly in 2016 and 2017 around 82.5 (follow the horizontal grey line on the chart). In 2019 I spent more than four months above that level!

In other words, it was a record-smashing year. Now let’s zoom in and take a closer look at 2019.

2019 Fitness Chart

First, note that grey line inside the chart. That’s my average fitness level from 2011-2018. Thanks to my winter training, I entered 2019 way above my usual fitness, and surpassed my typical midsummer peak form by the middle of February! And my fitness remained above average over the entire year.

Another big difference from last year is my consistency. In 2018, I couldn’t ride regularly, so its chart had lots of ups and downs. This year was steadier, only showing brief dips (for travel) in March and July, followed by that big dip in October, when travel, an achilles injury, and a cold kept me off the bike. I hopped back onto Zwift in November to build fitness for the 2020 season.

These two charts document a ton of hard riding; I could stare at them all day long.

And those green circles on the chart? Those represent my 100-plus-mile rides. That’s the next level of detail to talk about…

The Centuries

When asked what kind of cyclist I am, I say I’m a centurion. The most important and memorable target events of my year are centuries (100 miles) and 200ks (125 miles).

This year I demolished my previous mark (nine), logging no less than a record-shattering thirteen centuries over just six months! Two of those were longer 200ks, and one was my first-ever virtual century on an indoor trainer.

With seven of them crammed into an eight-week period in July and August, I relied on a well-planned, repeating pattern of: train, taper, ride your event, recover, and repeat.

My biggest disappointment of the year was that I missed Pittsburgh’s arduous Every Neighborhood Ride while doing another ride I’d already committed to.

Here’s my full list of centuries with comments and links to ride reports. Or you could watch my late-season summary video.

  • First Zentury (4/7)
    I extended one of Zwift’s 64-mile gran fondo events to complete my first-ever imperial century on an indoor trainer.
  • Sandy Lake 200k (4/13)
    Nearly my first outdoor ride was a 125-mile brevet: my longest ride in two years, confirming the effectiveness of indoor training.
  • Shades of Death solo (5/23)
    Rode a solo century from Pittsburgh to the West Virginia border to explore the Panhandle Trail and Shades of Death Road!
  • Escape to the Lake (6/8)
    Incomparable weather for the annual MS ride to Lake Erie, my only two-day event of the year.
  • PMTCC 3-State Tour (6/30)
    A foggy start gave way to a warm day for a familiar PMTCC ride to West Virginia and Ohio, with a thankfully modified route.
  • Absolutely Beautiful Country (7/14)
    Off to Akron OH for a club ride whose flat route was also altered this year, outrageously omitting the usual free ice cream rest stop!
  • Meanville Greenville 200k (7/27)
    Returned from a week of travel and dove straight into another long 200k brevet with the Pittsburgh Randonneurs.
  • Butler solo (8/4)
    Extended one of my long solo rides up Sun Mine Road, through Saxonburg to Butler and back.
  • Mon Valley Century (8/11)
    Enjoyed the return of an event that hasn’t been run since 2016 due to landslides; a third ride with a modified route (and poor support).
  • Four Rivers solo (8/19)
    My interwebs were down for 48 hours, so I went out and rode an easy solo century along Pittsburgh’s four rivers.
  • PedalPGH (8/25)
    As usual, I extended the PedalPGH metric to a full century, despite riding on an injured achilles and more ride organizer negligence.
  • Pedal the Lakes (8/31)
    Ended summer with a speedy and enjoyable PtL ride, completing 6 centuries in 6 weeks, and 8 in 10 weeks.
  • The Herd @ Leelanau Harvest Tour (9/14)
    The culmination of my season was a weekend trip to northwestern Michigan for an international gathering of Zwifters… and a scenic century alongside Lake Michigan.

Additional Highlights

One major development was my ability to train with a power meter, which allowed me—for the first time—to track my functional threshold power (FTP) and my power curve, which in turn helped me figure out my cycling “phenotype” as described in this blogpost. I also picked up and made good use of the defining treatise on the discipline: Allen & Coggan’s book “Training + Racing With a Power Meter”.

The biggest setback of the year was my late-August achilles injury, due to a combination of overuse and over-stretching. Although I completed three centuries while injured, it wouldn’t heal without time off the bike, which brought my season to an abrupt end. I’d hoped to do more easy autumnal riding, but there was very little of that.

I’ve already alluded to this year’s weather, which was simply amazing.

One fun tech project was creating the AlpenTimer, a Javascript webapp that helps you monitor and predict your pace up the Alpe du Zwift climb in order to earn the sub-60 minute achievement, break your own personal record, or just track your historical performance.

An artsy project was cutting hand-shapes out of Coroplast and spray-painting them cyan to mimic the blue “Ride On!” thumbs-up symbol that appears in Zwift’s virtual world. I hung a large one from the ceiling of my “pain cave”, and made a bunch of small ones for my jersey pockets.

One final disappointment was BikePGH’s Tag-o-Rama cycling/photography game. Regular participant Yale Cohen started harassing other players, driving many of them away. I don’t tolerate online abuse, so despite picking up 25 tags in 2018, I also quit Tag-o-Rama this spring.

Noteworthy Purchases

In the past, many of my “Additional Highlights” were things I bought, so I’ve carved out a new section to specifically highlight my new toys.

Most of this year’s purchases were on-bike equipment. A new Giro Aether MIPS helmet. New Prizm Road lenses for my Oakley Half-Jac sunglasses. A couple pairs of my favorite Craft Hale Glow bib shorts.

I ordered three new cycling jerseys, each of which comes with a unique story. I’m eager to show them off, but I'm still awaiting delivery of the last one, so I won’t say any more until an upcoming blogpost.

In terms of the bike, I got a Cygolite Hotshot 150 taillight, which crapped out after its first wet ride. I finally tested some Continental GP4000 tires I’ve had lying around; they were okay, but now I have to try their new GP5000s to see if they’re any improvement over my usual Michelin Power Endurance rubber.

I updated my Garmin bike computer with two new apps. I’m using Heart Rate Stress Score to replace Strava’s “suffer score” app, which became worthless when they changed its calculation. And I tried Multi-Page Race Notes for handy course notes, but fell back to old-school white electrical tape on my top tube.

The only noteworthy purchase that didn’t go on me or my bike was the aforementioned Allen & Coggan bookTraining + Racing With a Power Meter”.

List of Blogposts

And one final item before I look forward to 2020... It was a busy year here on ornoth-cycling.livejournal.com, with 24 ride reports and blogposts. Here’s the full list:

My 2020 Vision

That’s all she (he) wrote for 2019… What’s my outlook for the coming 2020 cycling year?

I don’t really expect to surpass my 2019 season, due to this year's confluence of circumstances. Will 2020 also feature great weather, limited travel, no job commitment, and an understanding partner who will loan me her car to get to distant rides? And can I continue to evade the growing concerns of age and health?

I’ll certainly continue Zwifting through the early season in order to hit the ground running once temperatures start to warm again. And I’m starting the new year at an even higher fitness level than 2019!

I’ll mostly target the same events I do every year, but there’s one known wrinkle in next year’s schedule. Instead of repeating the Leelanau Harvest Tour, next year’s Herd gathering will be outside Toronto, at the Epic Tour. That’s geographically convenient, and their 180km route will be the perfect distance for a September ride.

Other than that, 2020 will probably look an awful lot like 2019, and I have no problem with that whatsoever, since 2019 was one of my best years on the bike.

Bring it on!

I’ll admit it: I respond well to gamification, whether that’s keeping my streak of consecutive days of meditation alive on Insight Timer or—more pertinent to this forum—my indoor cycling on Zwift.

This fall Zwift added 25 new achievements to their existing set. The new ones are based on completing specific routes, which earn both an achievement badge as well as bonus experience points. A sucker for XP, I recently finished completing the entire set.

Of Zwift’s known cycling achievements, I’ve earned 57, leaving 7 badges that I’ve yet to achieve. And therein lies the rub.

Liftoff badge

One of them is simply a matter of time. Once you’ve climbed Alpe du Zwift—Zwift’s in-game copy of France’s Alpe d’Huez—25 times, you earn the “Masochist” badge. It’s a tough climb, but no problem there; I’ve already ridden it 11 times.

The second badge is too stupid to consider: the “Everest" badge for climbing the height of the world’s tallest mountain in a single ride. That’s the equivalent of nine Alpes back-to-back, which would probably take me more than 15 hours. That’s not fun; that’s just flat-out stupid.

Four of the remaining badges have to do with sprinting power. I’m no sprinter, but I’ve already earned the 500, 600, 700, and 800 watt badges; however, there are additional ones for hitting 900, 1000, 1100, and 1200 watts. I might conceivably earn the 900W badge, but it’d require a lot of force, shaking the trainer and possibly damaging my bike. But beyond that, I’m okay admitting I’ve never been capable of sprinting that hard.

And then there’s the final badge—the one that really irritates me—the “Liftoff” badge (above) that you earn for climbing the Alpe du Zwift in less than 60 minutes.

As of today, I’ve made 11 ascents, with an average time of 69 minutes and a best time of 62m46s. I’ve tried really hard, and come tantalizingly close.

It takes about 3 W/kg to break 60 minutes. At my weight, that means sustaining 230W for the whole hour. But my FTP—which is literally my maximum sustainable power over an hour—ranges around 200 to 220W. Unless I somehow get 5% stronger without gaining weight—or reduce my weight by 6% without losing any strength—the numbers unequivocally state that I cannot break the 60 minute barrier. Neither of those options are particularly feasible, and I’m not getting any younger here, folks.

And it’s pissing me off. I have no problem letting go of ludicrously stupid goals like Everesting; and I’m not bothered by challenges that are categorically impossible for me, like (literally) kilowatt sprinting.

But it’s this goal that’s perpetually just out of reach that irks me: something I could have done five or ten years ago, but can’t seem to surpass. It’s just too close to simply let it go and walk away from this particular challenge. So like a cycling Sisyphus, I keep destroying myself by attempting it—on the off chance it might happen—even though I know it will probably remain beyond my ability as an aging cyclist.

Psychologically, there’s a vociferous part of me that just can’t accept that it’s beyond me. I’m frustrated as hell; not so much because I can’t surpass the challenge, but because I keep listening to that goddamned voice and trying…

Until five months ago, I didn’t have a power meter, so training with power just wasn’t possible. Even today, I don’t have a power meter on the bike—just on the indoor trainer—but that’s enough to start drawing inferences from the power data I’ve generated over the winter.

One analytical tool for interpreting a cyclist’s power data is their Power Curve. Thankfully, it’s conceptually simple and easy to explain: it looks at your power data and plots your maximum power output (in watts) over every duration, from one second to an hour or more.

All riders can sustain maximum power for very short intervals (think finish-line sprints), but lower power at durations of one to five minutes, and less still for sustained efforts of 30 to 60 minutes or more.

That means the Power Curve looks similar for all riders: starting high, sloping sharply downward, then tailing off gradually. Plot a novice rider and a professional cyclist on the same chart, and there wouldn’t be much difference in the shape their lines, other than the pro’s being shifted higher due to their higher power output.

For insight into how it might be useful, let’s look at my current Power Curve (click for full-size):

Ornoth's Power Curve

There are essentially two ways of looking at this information: how much power can I expect to produce for a specific duration; or conversely, how long can I expect to hold a specific power level?

In my case, for a 10-second sprint I can produce 800W, but for a 60-second sprint I can only sustain half that. For a 10-minute max effort I could expect 260W, about 235W for an hour, dropping down to 165W for anything longer than two hours.

Those estimates all hold whether I’m trying to figure out how much power I could hold for a specific time, or how long I might be able to sustain a specific power output.

That’s great information for planning a workout or figuring out how to pace yourself on a max-effort ride; however, it doesn’t tell you anything about my individual strengths and weaknesses or how I compare to other cyclists. To do that, we need to introduce comparative data, which is provided by additional research.

Through empirical testing, a team of researchers—including the well-regarded physiologist Andrew Coggan—calculated expected athletic performance ranges for power output at durations of 5 seconds, 1 minute, 5 minutes, and an hour. Comparing an athlete’s Power Curve against those calculated norms yields an understanding of an individual rider’s strengths and weaknesses.

The research team took riders with similar strengths and weaknesses and aggregated them into commonly-recognizable categories which in true scientific fashion they gave the officious label “phenotypes”. An athlete who excelled at short efforts was a sprinter; whereas someone producing above average power over an hour would be a good time trialist, climber, or steady-state endurance rider; and someone with equal performance across the entire time spectrum would be an all-rounder.

So what can I learn about myself from my own chart?

Ornoth's Phenotype

The obvious first conclusion is that I’m no professional athlete! My 5-second sprint is pretty pedestrian, and my 1-minute power doesn’t even register on the chart! However, my 5-minute power is in the upper half of the “Fair” range, and over 60 minutes I’m a fraction below “Moderate”. In comparison with professional athletes, that’s pretty impressive for a 55 year-old!

The chart shows that although I might lose a two-up sprint with a corpse, I will have unequivocally stronger results the longer an event goes. That marks me as a time trialist, climber, and/or endurance rider: something that shouldn’t surprise anyone who knows anything about my riding style and history. But it’s nice to have that confirmed by quantitative data.

For any athlete who is given this data, the next question is what to do with it; and the answer is a resounding “Do whatever you want.” Do you want to work on strengthening those areas where you are weakest, to improve your overall performance? Or do you want to maximize your strengths to derive the most benefit from them? That’s entirely up to you.

Since my cycling goals are mostly limited to centuries and 200ks, I’m perfectly happy continuing to work my endurance, and living in Western Pennsylvania is guaranteed to build up my power over short, steep climbs.

Armed with this new understanding of the wattages I can sustain over specific durations, I could put a power meter on my bike to get live power readings, which would allow me to perfectly gauge and pace my efforts in real-time. That expense will probably have to wait until the next bike, tho.

When I moved to Pittsburgh in 2015, I didn’t bother bringing my old wheel-on indoor trainer. It was outdated technology, falling apart, and I planned to replace it after the move anyways.

But I was able to do some outdoor riding through the Pittsburgh winter, and I couldn’t bring myself to drop a boatload of cash on a replacement trainer, especially since I’d be moving to still warmer climes sometime soon.

And just like that, three years passed.

What finally spurred me to pull the trigger on a new trainer? And what conditions changed?

Wahoo KICKR CORE

First, why invest in a trainer if I still don’t have any income? Well, I’ve had the intention to do so for five years, and I have the money… I just don’t like parting with it. But I know this is something I’ll use a lot.

But will I? Why invest in a trainer if I plan to move south? Fair point. However, if there’s one thing I’ve learned living in Pittsburgh, it’s that—even when the weather’s great—sometimes you just don’t want to expend the effort of getting out of the city to get a workout in. I might not ride the trainer as much if I lived in Florida or Texas, but it would still get used, especially for fitness tests. And if not, I could always sell it to someone else!

One last question: why bother with a trainer if I’m getting old and will never be as strong or competitive as I used to be? Well, just because I’m not setting any new PRs doesn’t mean I’m giving up completely! I still want to perform at my best, and having a trainer makes it much easier to get a workout in, so that I can better retain the fitness I’ve got left.

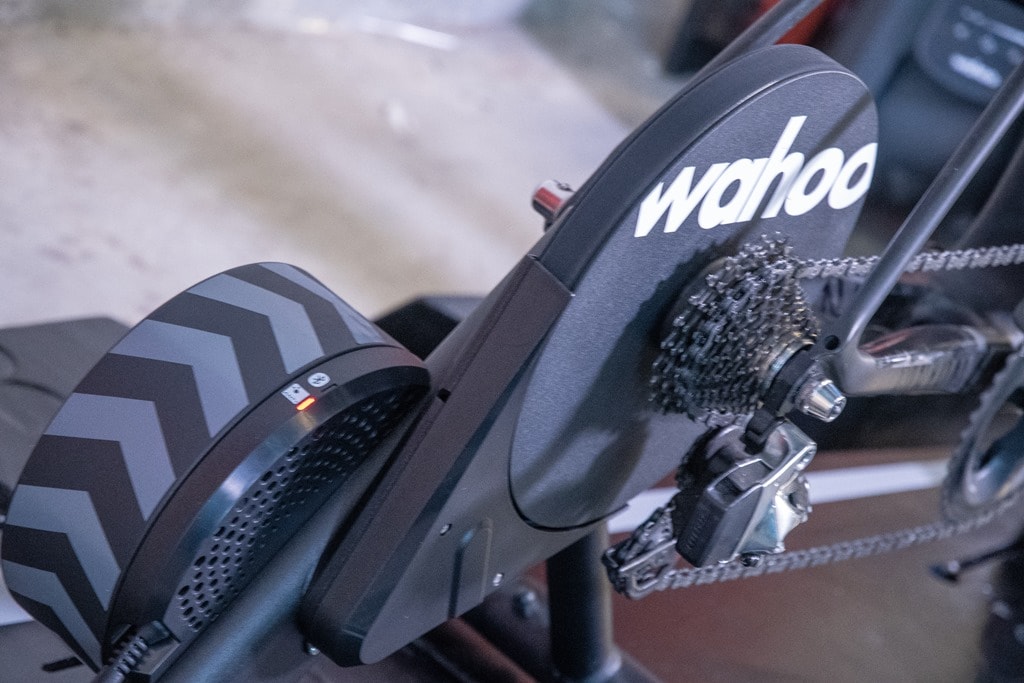
Another thing that made the purchase easier was a big $180 discount. Each fall, awesome sports tech reviewer Ray Maker (DC Rainmaker) teams up with a sports tech dealer to offer the best sale of the year. In my case, I got a solid 20 percent discount on the Wahoo KICKR CORE: a state of the art trainer that was only announced four months ago.

The downside: the three-week wait for it to arrive. Even though his dealer stocks up for the big sale, hot new products inevitably get backordered. But eventually it arrived.

In the meantime, I dealt with other logistical issues. Downloading and reading the setup and user manual. Downloading and learning how to use the Wahoo Fitness app, the Wahoo Utility app, the Zwift app, the Zwift Companion app, and the Discord app. Buying a new cassette (gears), along with a chain whip, crescent wrench, and lockring tool to install it on the trainer (as well as for future use). Buying a floor mat, gym fan, and riser block for my front wheel. Buying a handlebar phone mount, a USB ANT+ dongle, and a USB extension cable to go with it. Setting up a television, laptop, speakers, and wireless keyboard and mouse in the new “pain cave”. Buying a membership to the Zwift MMO virtual world. So many new things to buy, set up, and learn!

Now that it’s here, what’s so great about this thing?

First, it’s a direct-drive trainer. That means you take your rear wheel off and connect the bike’s drive train directly to a set of gears on the trainer, rather than pressing a steel roller up against the rear tire, as cheaper and older trainers used to do. That takes a lot of wear and strain off the tire and wheel.

It also allows the entire contraption to be a lot quieter. A vast improvement upon older devices, now the only noise you’ll hear are the bike’s chain, gear shifts, the exercise fan I use. Even while I’m riding in the next room over, Inna is able to sleep through it.

A huge benefit to me is that most trainers now come with built-in power meters. While inexpensive heart rate monitors have been used to guide training in the past, power meters have supplanted them as the gold standard. However, power meters are pricey, so I’ve never been able to justify the expense. But now I can train with power, at least indoor.

There’s a lot to know about training with power, but my primary interest boils down to watching two numbers. Functional threshold power (FTP) is an absolute measure of how much power you can sustain on the bike for one hour (measured in watts), and is a great predictor of performance on the flat. Divide FTP by your weight to get watts per kilogram, which is an equally reliable predictor of performance when the road tilts up. These are today’s gold standard measures of cycling fitness.

To ascertain your FTP, you do a 20-minute FTP Test. But doing FTP tests sucks. The testing protocol is simple: hold the maximum power you can for 20 solid minutes. It hurts, and a lot of people puke before they finish.

It’s also error-prone, because it’s hard to guess how long you can maintain max power. Most people overestimate their ability, going out hard and running out of gas before the 20 minutes is up. Once burned, they do the opposite, keeping way too much in reserve. So how do you figure out what power you should try to hold so you can pace yourself properly?

That calls for another test: the Step Test. It’s not fun either, but it entails slightly less pain. Once you begin pedaling, the trainer gradually increases the resistance every two minutes. Continue cranking on the pedals until eventually the increased resistance causes absolute muscle failure.

I stopped my first Step Test a little after hitting 275 watts. After applying maths, my FTP—what I could hold for an hour—was around 212W, and my climbing ability was 2.72 W/kg. The Step Test only provides a rough estimate of FTP, but most importantly, it also told me I should aim to hold 223W for my 20-minute FTP Test.

Armed with that information, two days later I set out and tried to hold my average wattage above 223 for 20 excruciating minutes. I managed it for about half the test, but I found myself riding the entire test pegged at my max heart rate—not fun!—while watching my average power slowly decline. By the end of the test, I’d faded to an average of 208W, which translates to an FTP of 198W, and 2.53 W/kg: noticeably lower than the numbers I got from my earlier Step Test, but just enough to qualify for the low end of Zwift’s Category C performance level.

I’ll probably test myself every three or four months, to see how much I improve (or deteriorate) over time.

Beyond measuring power, we move into features associated with “smart trainers”. So what makes them think they’re so smart?

Orny leading a paceline in London
Orny descending a mountain in Watopia

Basically, the industry has defined communication protocols so all your devices can work together: trainers, power meters, heart rate straps, cadence and speed sensors, bike computers, electronic shifting, and phone and computer applications. One of the things they’ve done is allow other devices to control trainer resistance: allowing applications to control how hard it is to pedal on the trainer.

That permits trainers to simulate the ups and downs of riding on real roads. In “sim mode”, you can load up any real-world route, and the trainer will precisely mimic the terrain, making it harder to pedal when you reach a “hill”, and easier when you reach a descent. You can simulate any route you can map: from Tour de France stages to last August’s century to your daily commute.

This was the first thing I tested when my trainer arrived. I paired it with my bike computer and told it to re-create a short local route I rode a year ago. As I pedaled along, the trainer automatically changed resistance to reflect the descent down Greenfield to the river, up the Junction Hollow bike path, the little spiker up South Neville, thru CMU, then up and over Schenley Park on Overlook Drive.

The grade simulation worked well, and it made for an engaging workout. However, there were clear shortcomings. The bike computer didn’t display the elevation change, current incline, or total elevation gain; the closest one could get was the graphical display of the past and upcoming elevation profile, which wasn’t detailed. More annoying, the unit didn’t display my current “location” on a map, which would give a little more context to the ride and changes in resistance. While sim mode is an awesome idea, there are obvious improvements that need to be made.

If you combine a smart trainer’s sim mode with internet access, virtual reality, object modeling, and social networking, you get today’s pinnacle of indoor training technology: Zwift. Join Zwift and you’re given an on-screen cyclist avatar who moves along a virtual road in proportion to you pedaling your trainer. Ride around online versions of London, New York, Innsbruck, or Richmond VA, or even the infamous Tour de France climb up Alpe d’Huez. When your avatar reaches a hill, the smart trainer’s resistance kicks in (or off) to simulate the gradient.

Now add other riders: thousands of other riders, all pedaling their own avatars in this massively multiplayer online sufferfest. Add structured workouts, the ability to ride with friends, organized group rides, official races, milestone rewards, instant messaging and shared audio channels, and also a parallel setup for runners. It’s an immense phenomenon.

My first Zwift experiences have been positive, but not always pleasant. Although the app hasn’t crashed on me yet, my laptop has died multiple times due to (1) falling off the pedestal I’d placed it on; (2) running out of battery without warning; and (3) a touchy touchpad that causes spontaneous reboots. I was already thinking about a new laptop, but the slow frame rate on my five-year old graphics card have increased the likelihood of that expense.

So far, in addition to the Step and FTP Tests, I’ve done a 10-mile free ride; a 25-mile, 450-person Team ZBR group ride; and the extremely hilly 30-mile December Bambino Fondo, with several thousand others.

Overall I’m happy. I finally have a new indoor trainer. I can even begin training with power! And with Zwift, I’m more likely to spend time on the trainer than I would have on my own.

That leaves me with one issue I’ve struggled with since I got my first trainer a decade ago: whether to count miles ridden and time spent on the trainer as “real” riding time for statistical purposes. Back in 2009, I decided I would only count outdoor road miles, but as my indoor riding increased, I started informally keeping track of that separately. Now I’m likely to put even more miles in on the turbo, so I’ll record my indoor riding separately, but in the same level of detail as outdoors. That way I can combine the two when it’s appropriate, and keep them separate when needed.

Frequent topics