Every year has its ups and downs, and its major milestones. But every so often something happens that is so significant that you can divide your whole cycling career — perhaps even your entire life – into “before” and “after”.
2024 started quite well; I was riding consistently, tried some new things, made a few events, but missed a few others. In the first nine months of 2024, I knocked out 7,000 kilometers, an average of 25.75 km per day.
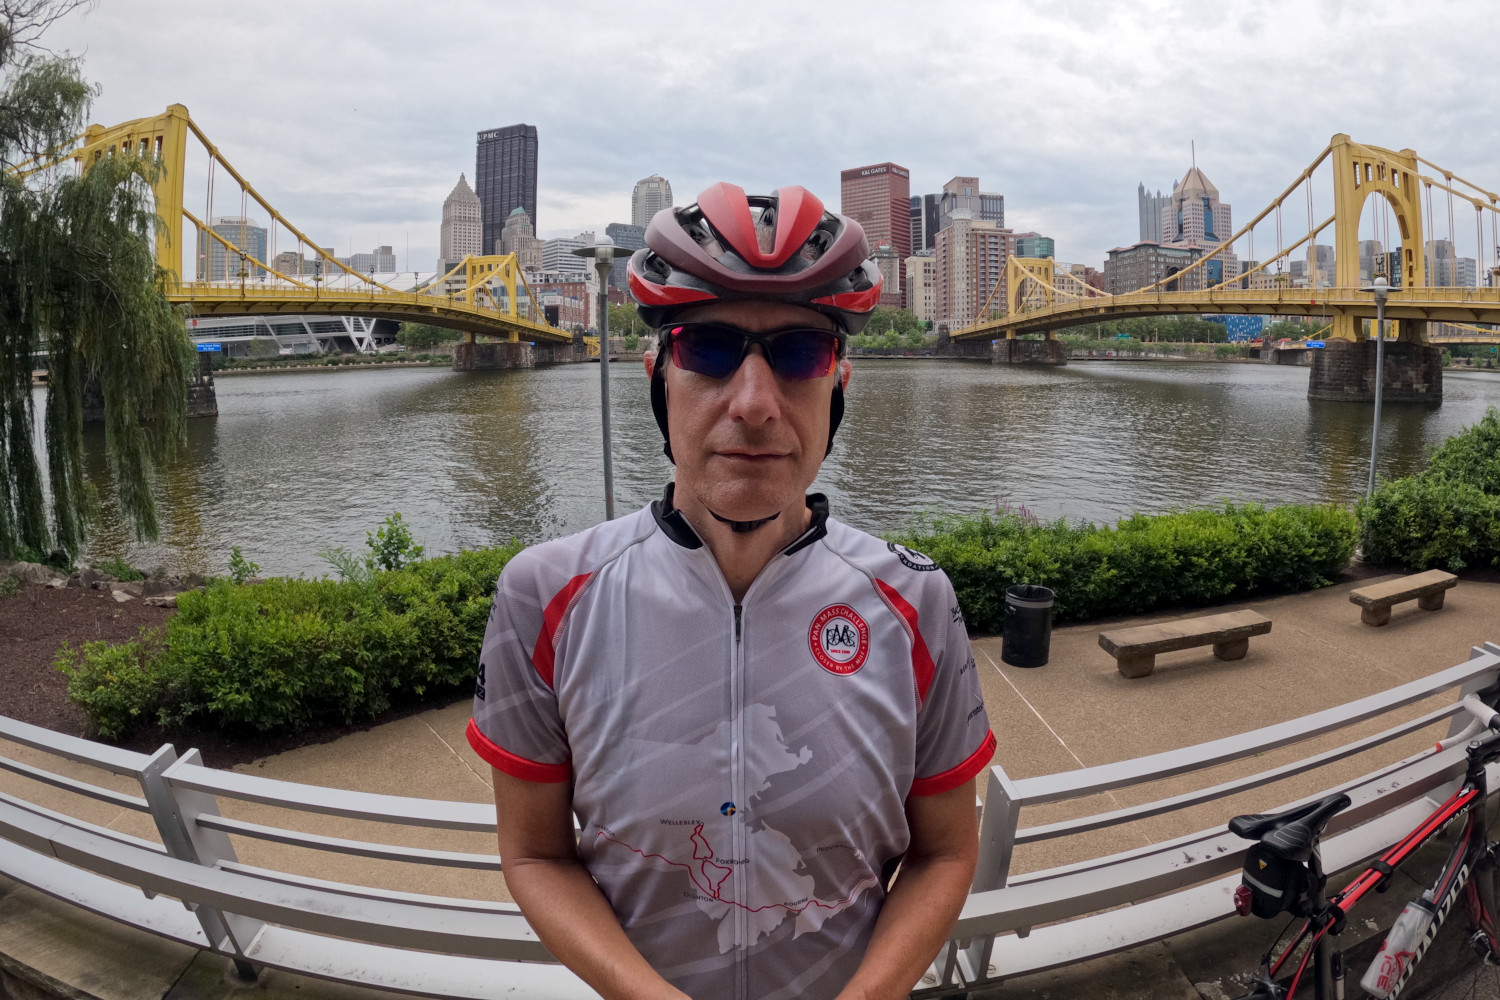
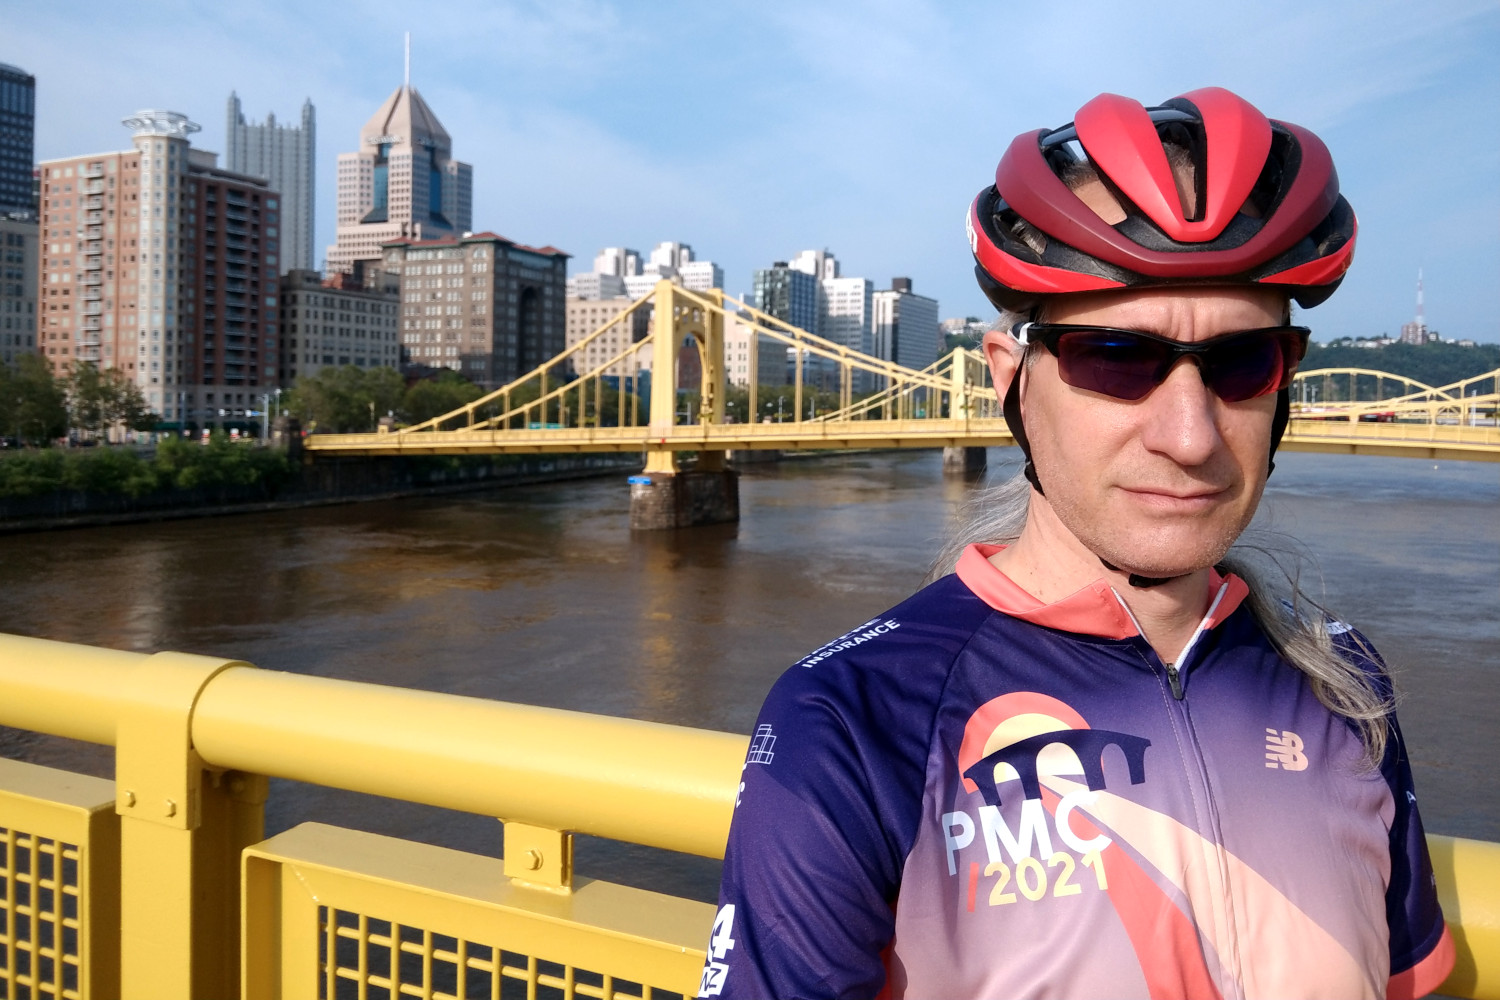
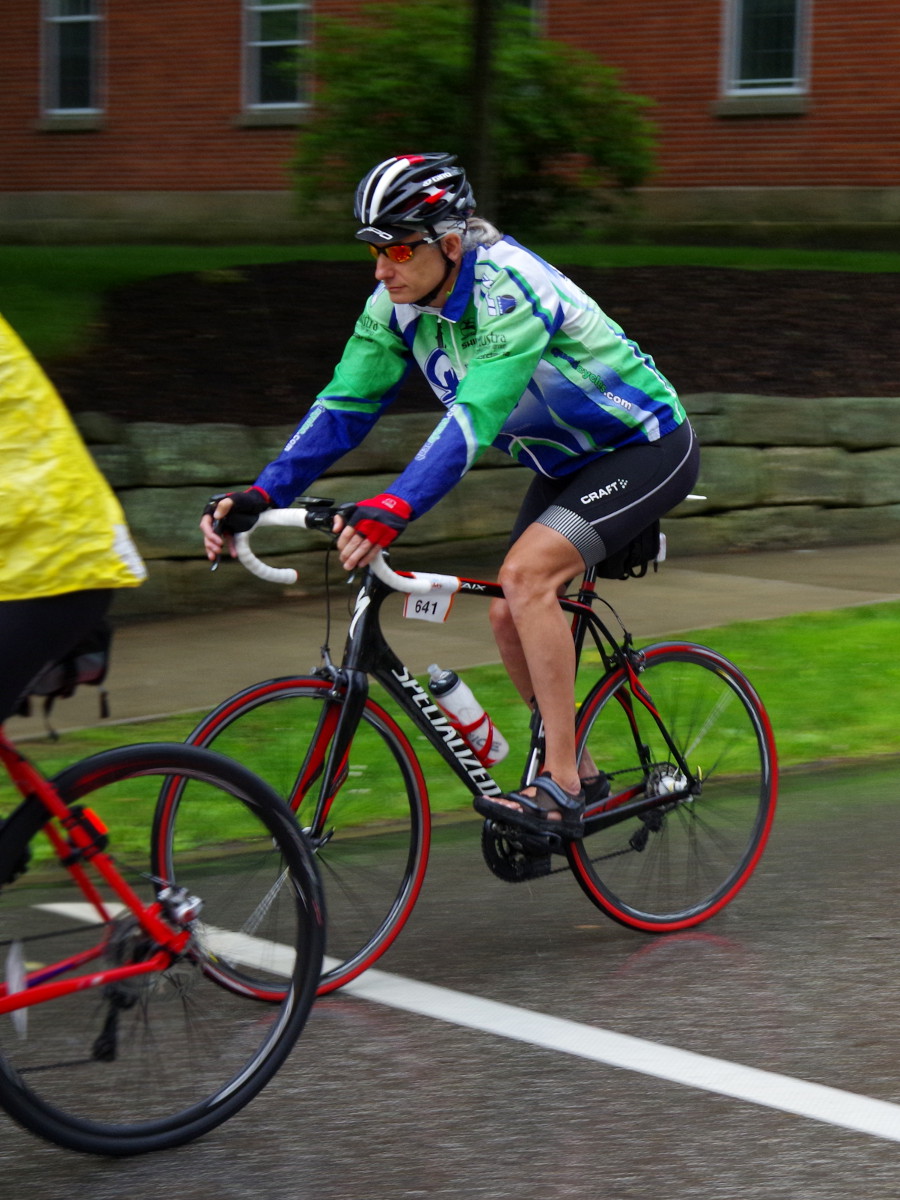
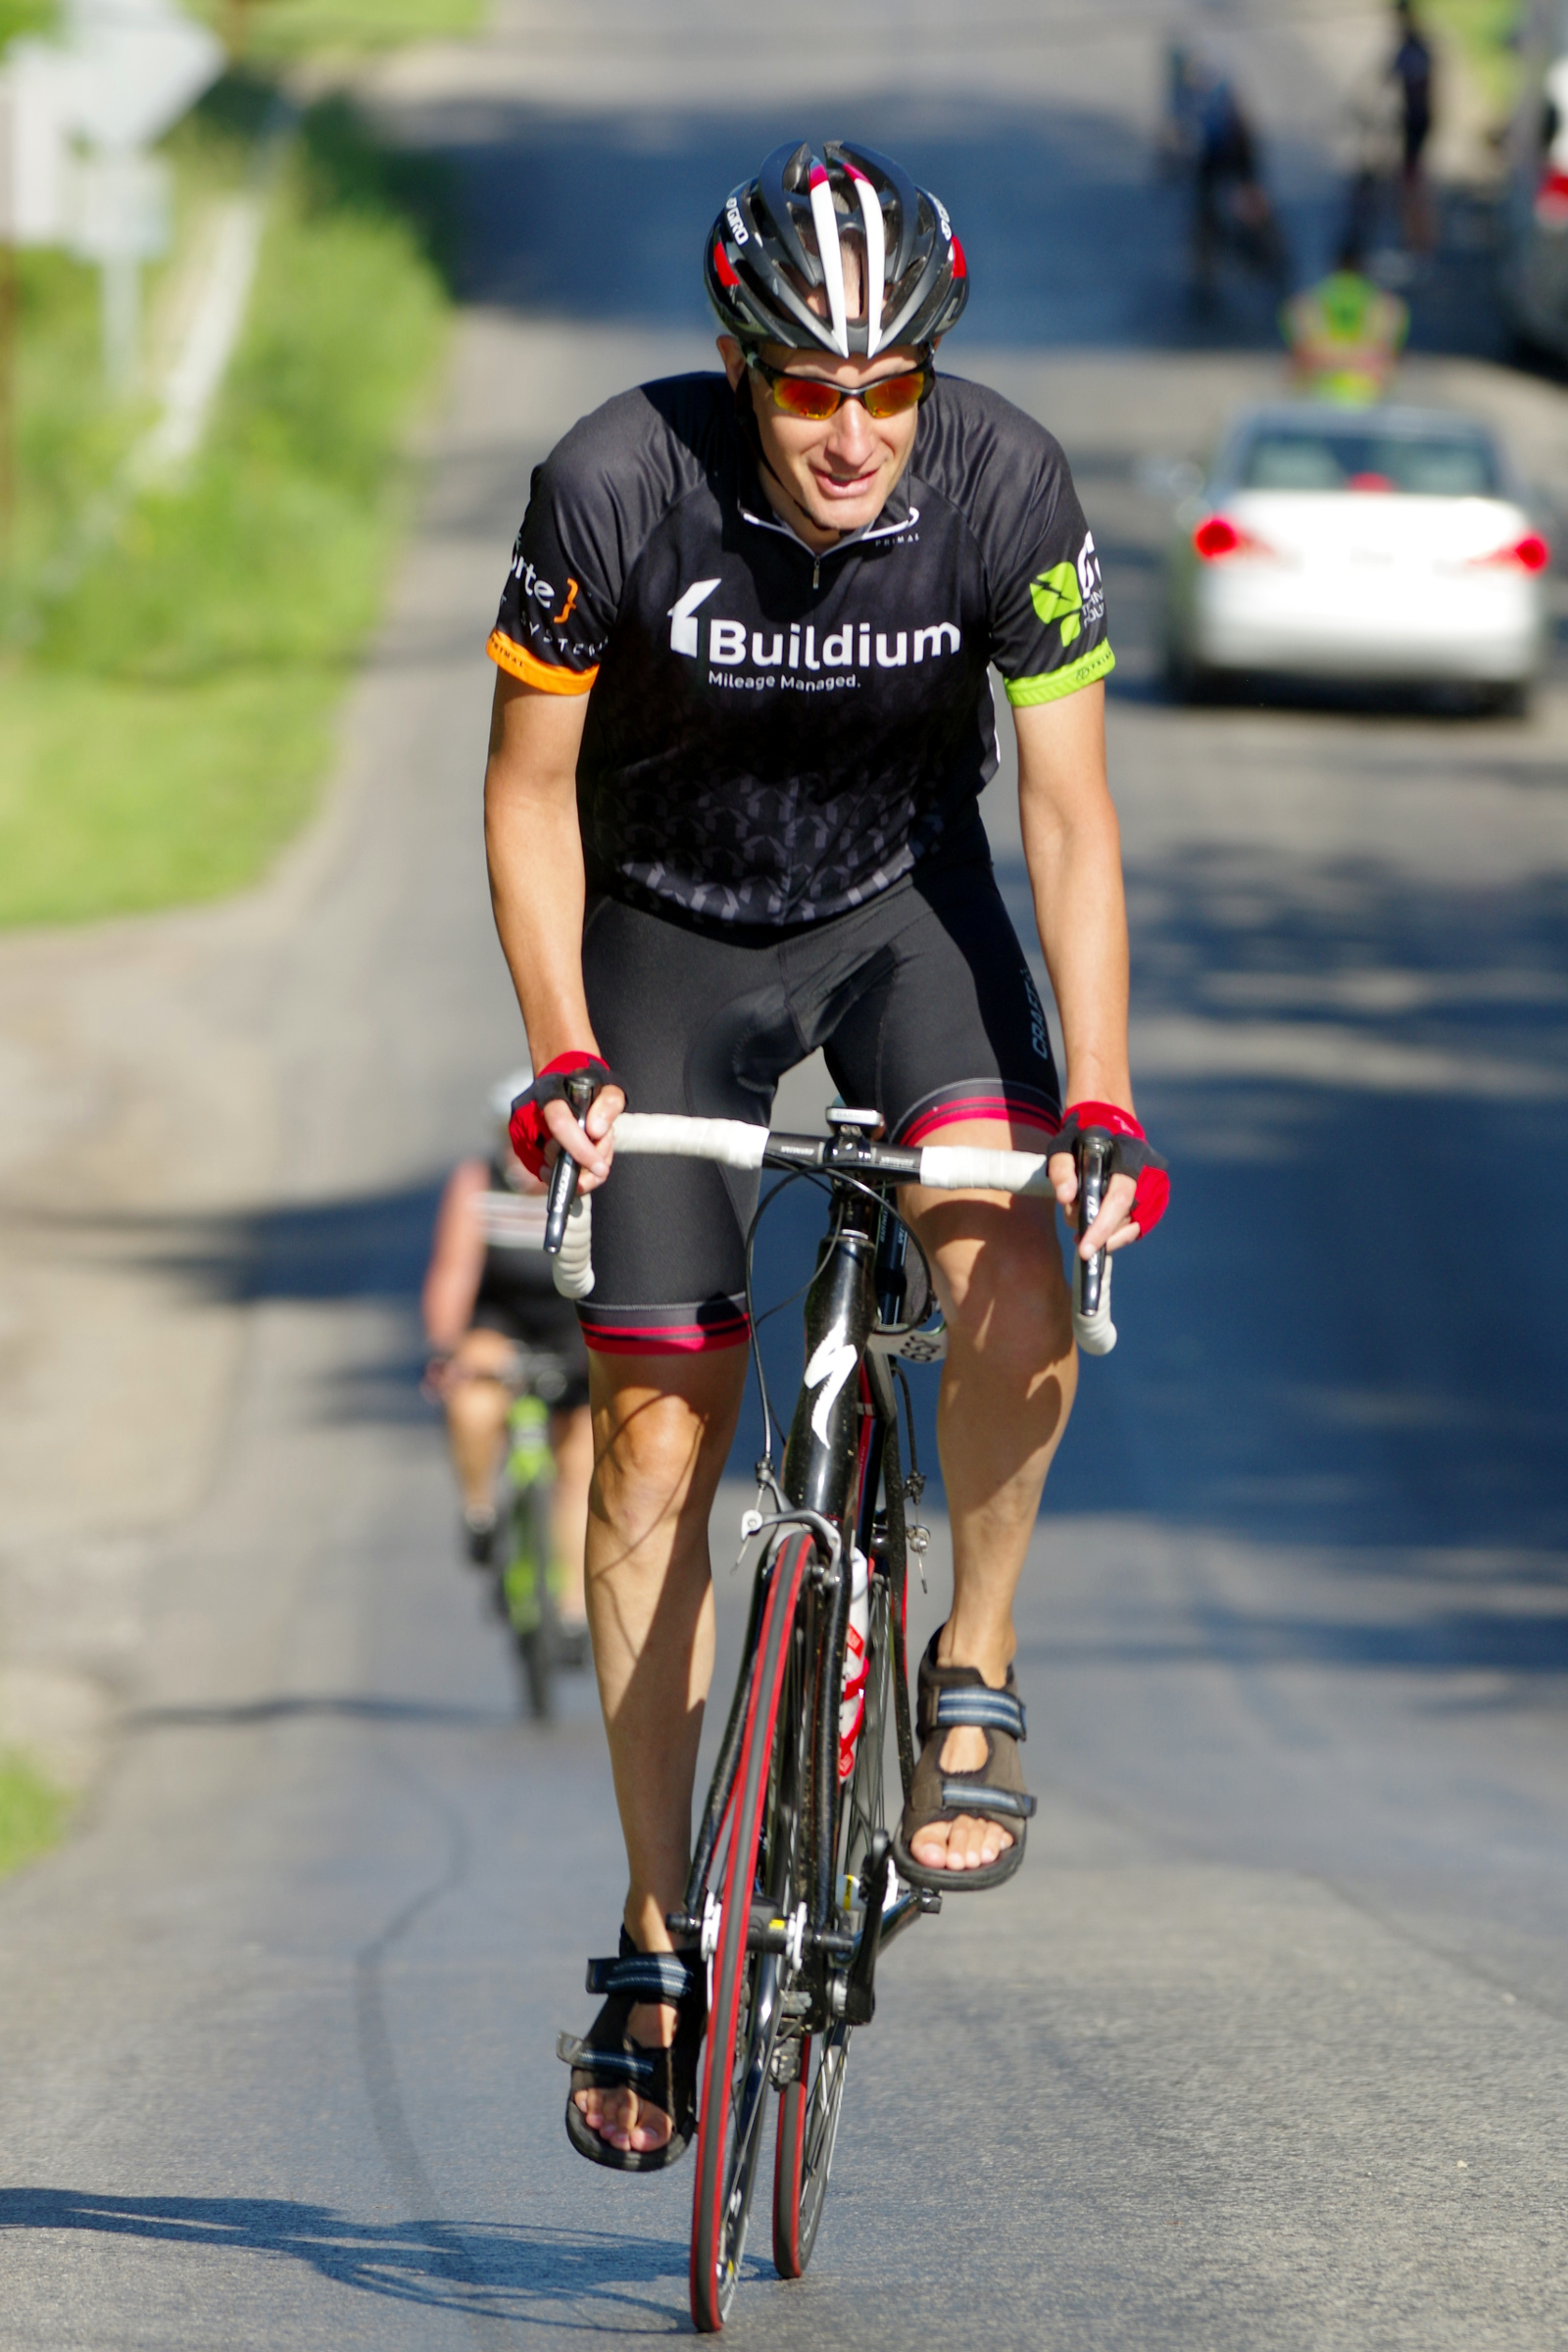
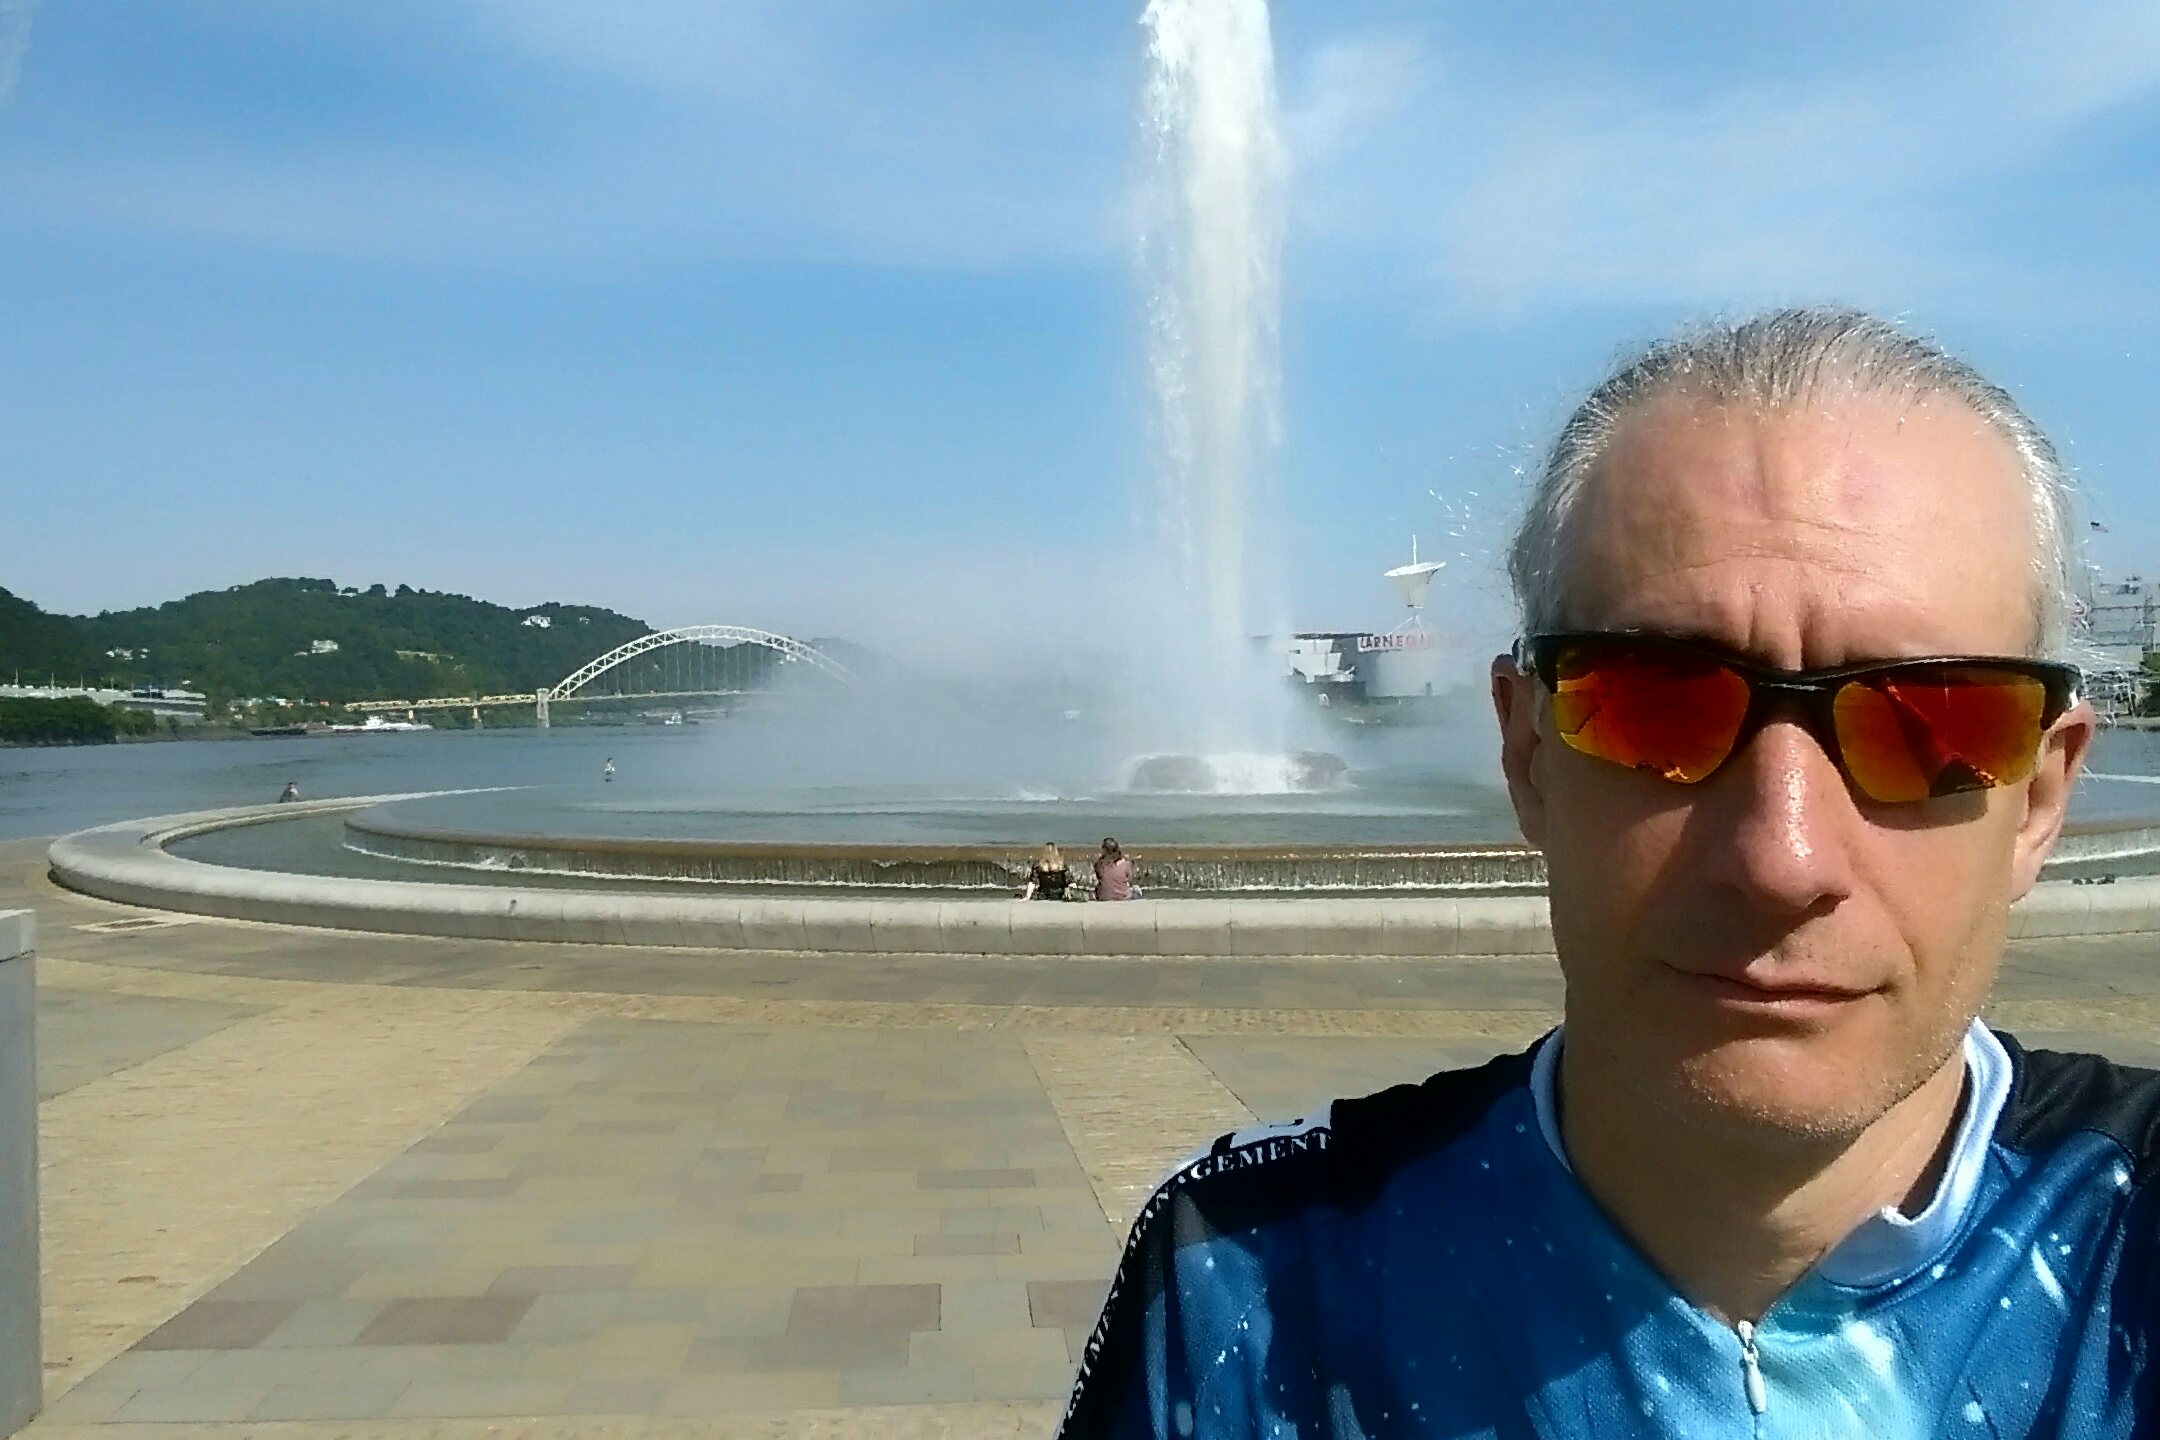
 Showing off the Austin skyline during my Pan-Mass Challenge ride. |
And then there was October 4th: my stroke. Thankfully it was extremely minor, but it negated all my plans and goals as a cyclist in an instant. It reduced everything I’d done before then to history, forcing me to begin again from scratch.
The good news is that I’ve recovered remarkably well. As I mentioned in my first post following my stroke, I’ve prioritized riding the indoor trainer over riding outside. Since I got back on the bike in mid-October, I’ve logged another 2,000 km, or about 25 km per day, a rate which is almost even with my pre-stroke riding.
My plan was to get back out on the road this spring to test my capabilities. But that’s the future; for now, let me look back on the past year and give you an idea how things went both before and after October 4th.
All told, I knocked out a total of 9,250 kilometers, or the distance between London and Tokyo, or from Los Angeles to Rome. That actually surpassed my 2023 total by 1,000 km, and my riding was split 63% outdoor rides and 37% Zwift.
As for whether I met the goals I’d set for myself…
My Original 2024 Goals
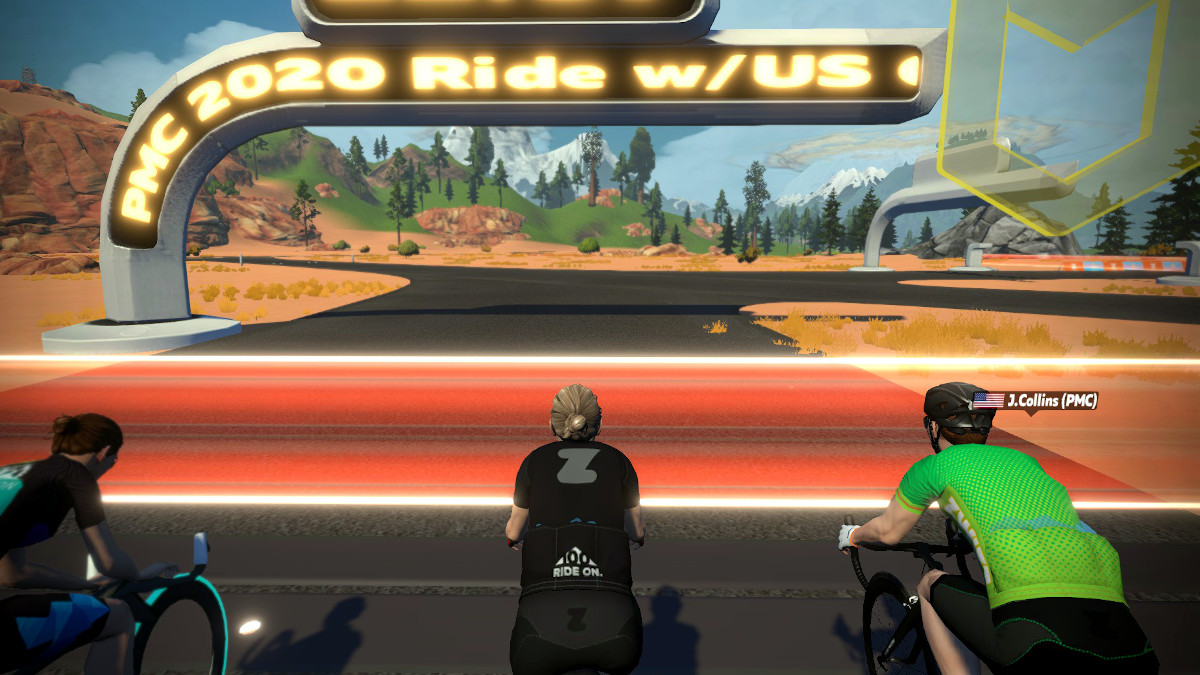
 Ushered in 2024 with a New Years Day Pan-Mass Challenge group ride on Zwift. |
 I returned to the Fire Ant Tour metric century for a second year. |
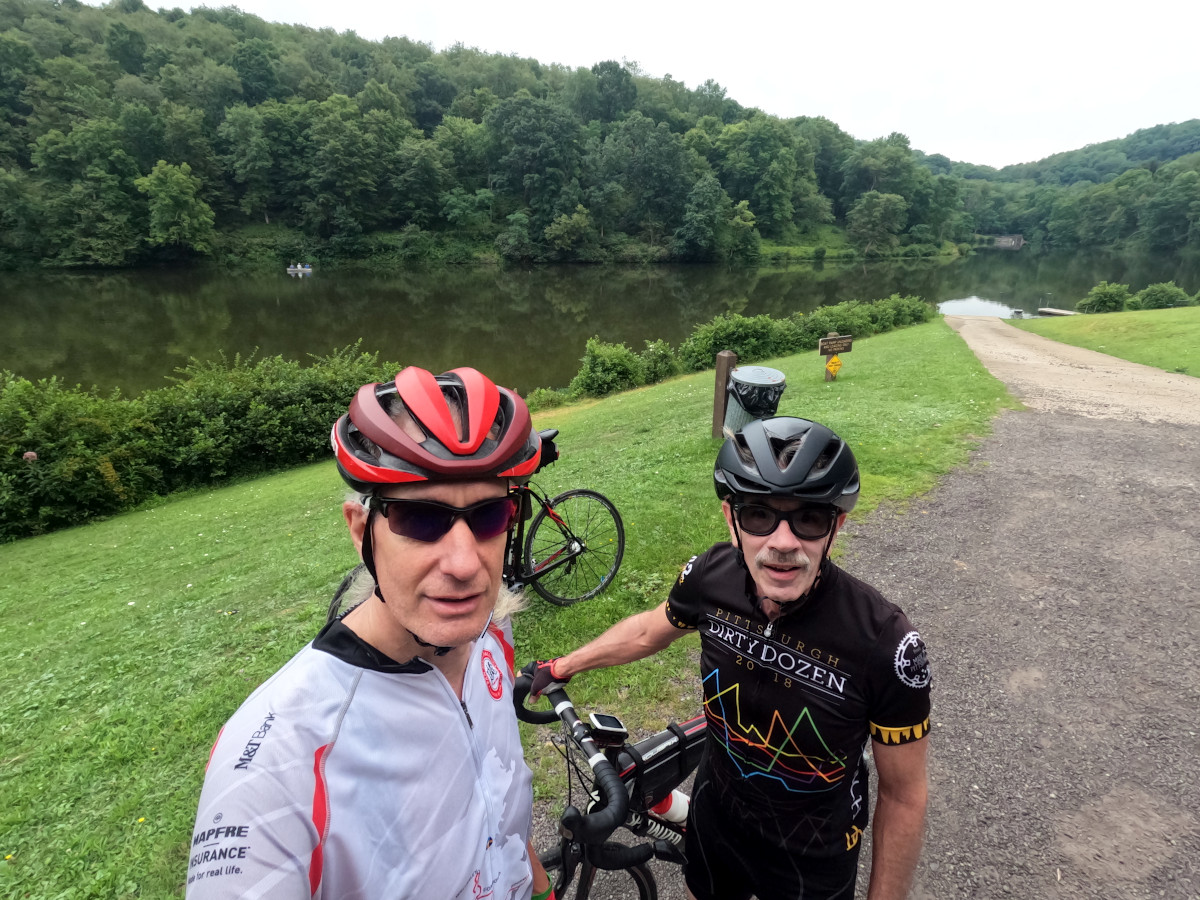
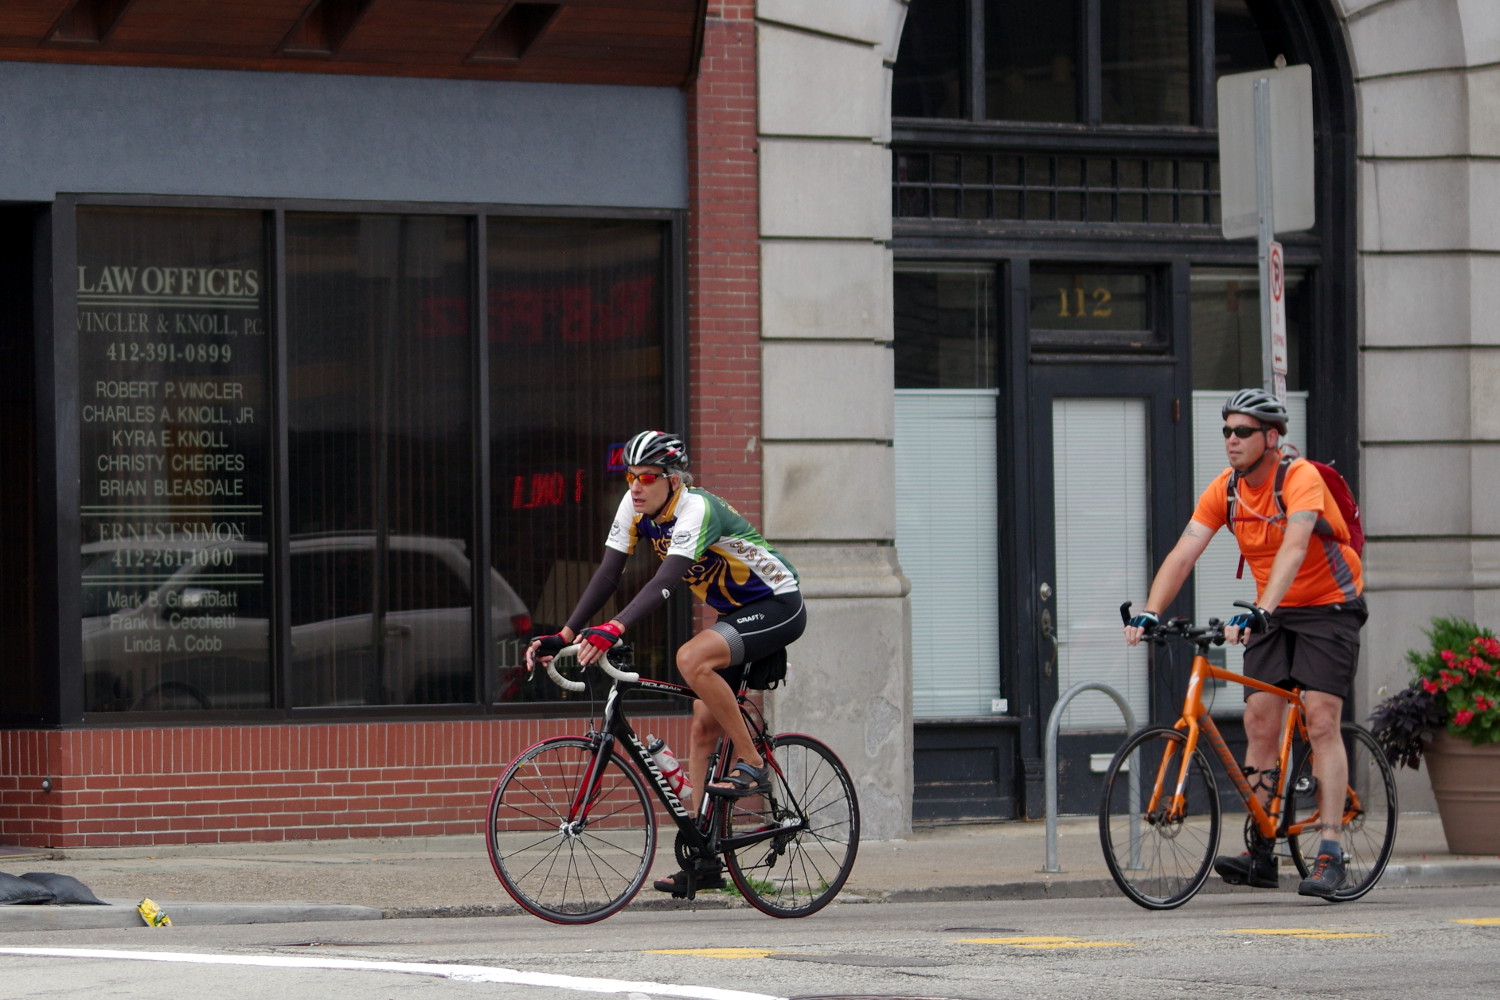
 Tried the Team Tacodeli group rides, but barely saw anyone but these two… |
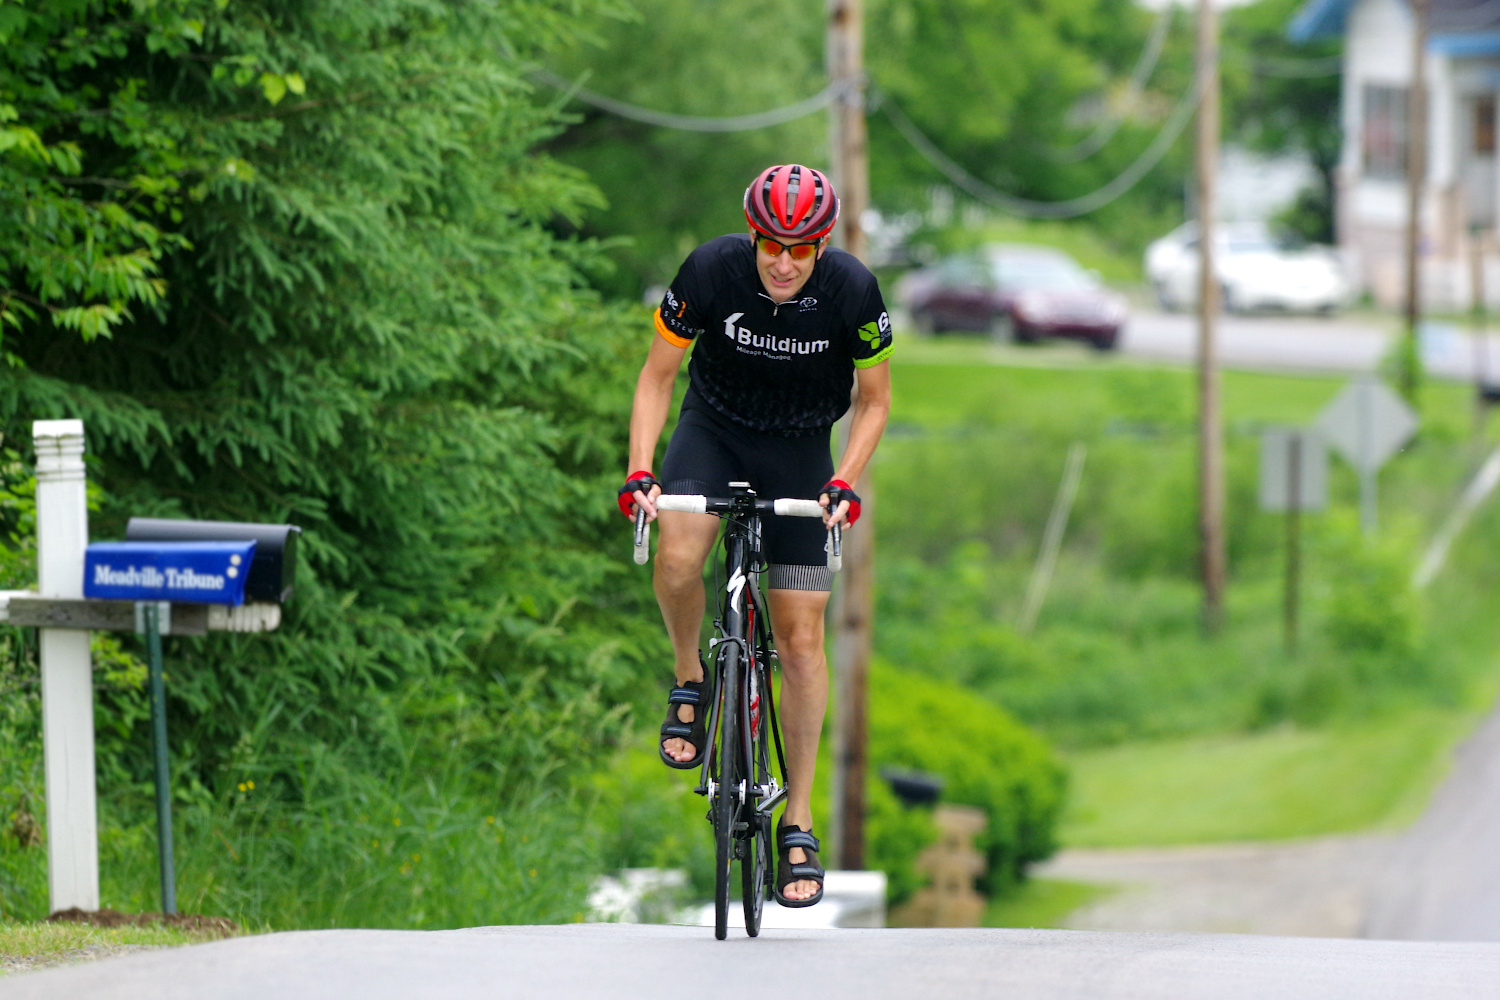
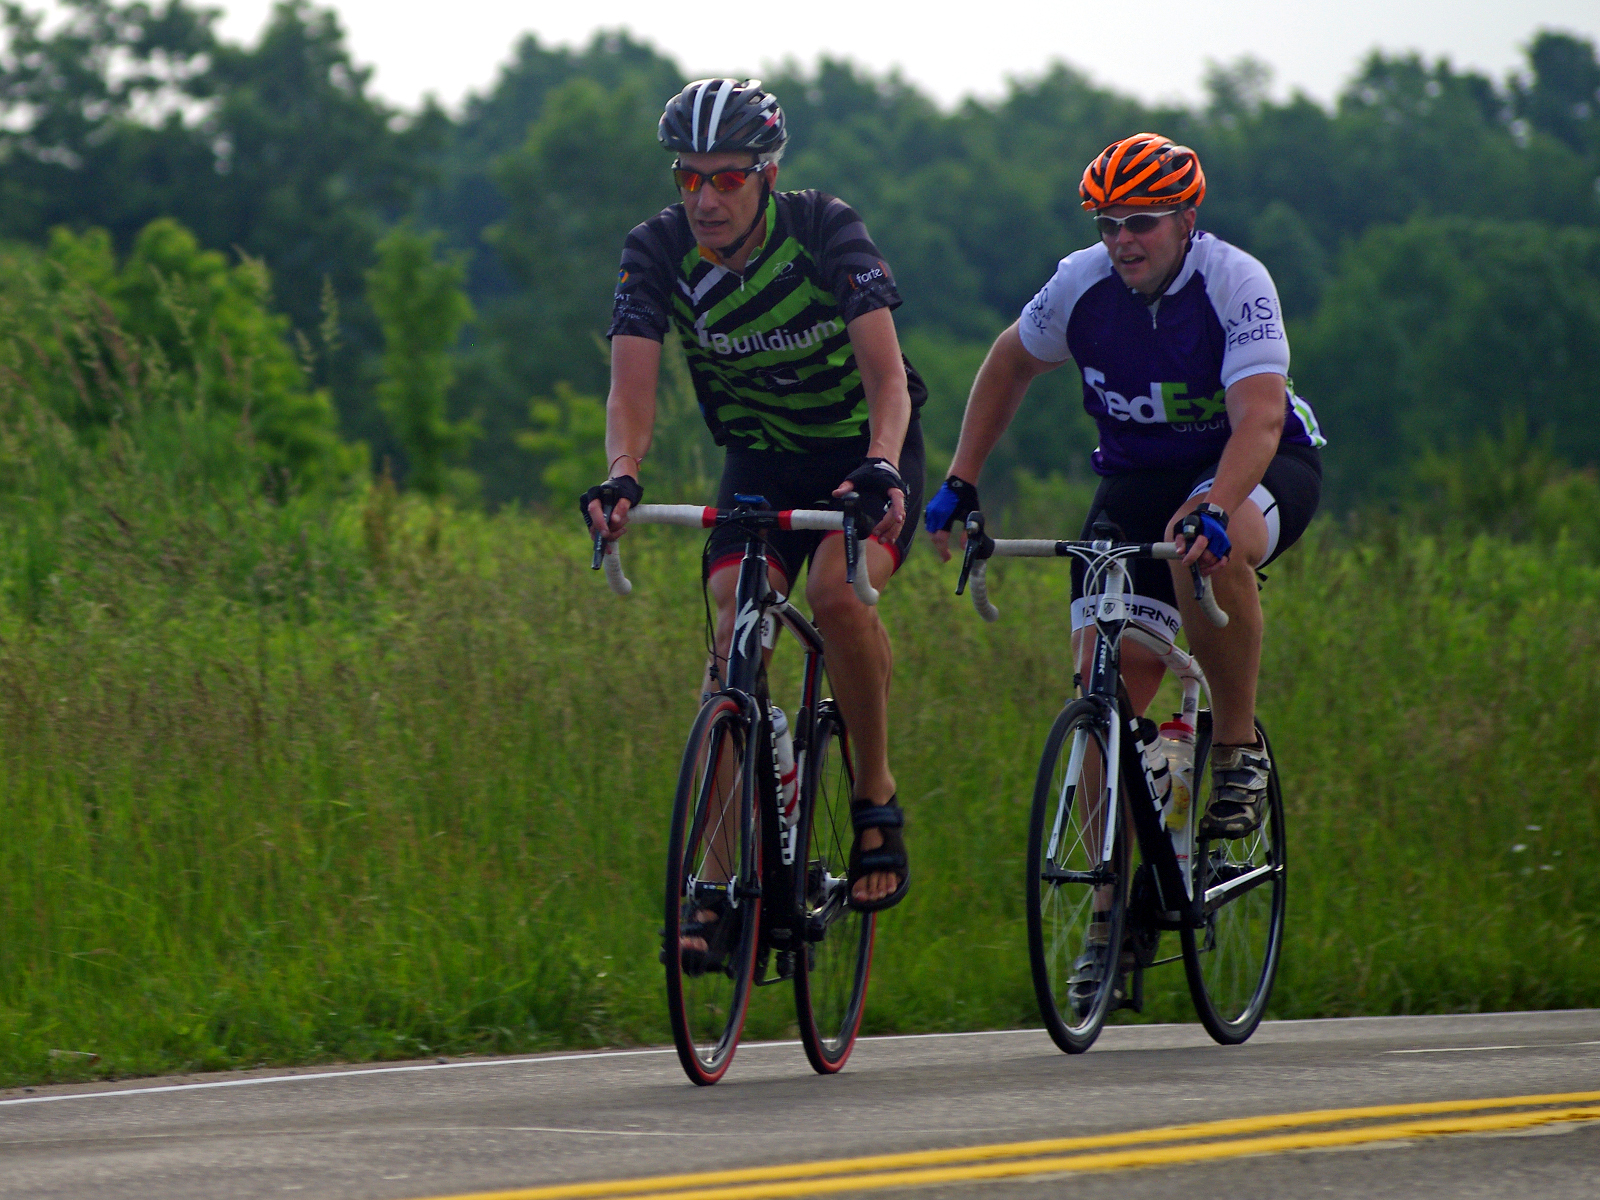
 I was again a regular at the Friday Truancy group rides, tho I struggled to keep up. |
Last year at this time, things were still up in the air following our move to Austin, so my 2024 goal-setting exercise was short on specifics. But I did call out three specifics areas of focus.
More 100k and Century Rides
2024 was a little better than 2023 in terms of long rides, but there were also a lot of missed opportunities.
On the plus side… I did complete two centuries: my first Red Poppy Ride, and my solo Pan-Mass Challenge Day 1. As for metric centuries, I rode my second Fire Ant Tour, plus two solo rides out to Manor, one of those comprising my PMC Day 2.
But the list of excuses and missed rides is regrettably long. I didn’t feel ready for the early-season Pedaling the Prairie or the two-day Texas MS 150. I skipped the Tour de Boerne so that I could make a rare kyūdō practice at the outdoor range. I canceled my planned Katy Flatland Century when I learned that the local Trek club was hosting a long tour around Austin, which I still missed because I contracted COVID. And my second Livestrong Challenge eluded me when I had a stroke two weeks before the event.
So I was both happy and a tiny bit disappointed with the first nine months of the year. And after my hospitalization, long rides just weren’t in the cards anymore.
Find My Group Ride Niche
I continued my frustrating quest to find enthusiast-level group rides in Austin.
Continuing last year’s trend, I regularly attended the Friday Truancy rides, making 28 of them before being sidelined by my stroke. However, for the first time in my life I was utterly incapable of keeping up with the group. So, for me, these still wound up being essentially solo rides: group rides in name only.
I did try riding with Team Tacodeli on Monday evenings, which were shorter and at a more moderate pace. I joined them five times in June, but three of those were only attended by two other riders, and once I was the only rider to show up at all! Then they went on summer hiatus, and that was the end of that. To my knowledge they haven’t resumed on any regular basis since.
So despite giving Team Tacodeli a fair shot, I still haven’t found what I’m looking for.
A Big Pan-Mass Challenge
On a much more positive note: after skipping the event in 2023, I enjoyed a tremendously successful return for an 18th PMC ride. In brief, it was:
- My first PMC ridden remotely in Austin
- My first PMC as a member of Team Kermit
- My first PMC as a sexagenarian
- The ride went really well
- I enjoyed creating an awesome 2024 PMC highlight video
- And I raised $7,300 for cancer research; a stunning 62% increase over my previous ride (2022), bringing my lifetime fundraising total to $130,800
My ride video and all the deets live in my 2024 PMC Ride Report.
So in terms of meeting the goals I’d set for 2024, I’d say I did okay. It certainly could have been better, but I’m still happy with how it went.
Charts
Because I kept riding throughout the winter of 2023-2024, I had virtually no drop-off in my Fitness level, as measured by my Chronic Training Load (CTL) numbers.
Previous years – including my first year in Austin – featured a lot of variability, characterized by peaks in Fitness during the summers, and troughs in the winter. In contrast, my Fitness stayed almost constant throughout 2024. Thus it wound up being my most consistent year on record, as you can see in the following chart.

To quantify how steady it was: in the decade from 2012 to 2023, the standard deviation of my Chronic Training Load averaged 16.7 – and it was never less than 11.7 – but in 2024 it was just 4.9! And it was actually a mere 3.5 before I contracted COVID in July and my stroke in October, which were the only noteworthy hiccups in my training all year.
Another way of looking at it is to compare my Fitness with my long-term average, as you see in the following chart, which zooms in on 2024:

In a February blogpost, I predicted that my my natural response to having rideable weather year-round would produce a much flatter curve than in previous years. I projected that my Fitness would be higher than average during the winter months, but during the extreme heat of summer it would never reach my usual peaks… and might even decline slightly from springtime highs. And that’s exactly what happened in 2024.
Basically, this is what I think it’s gonna look like to be a year-round cyclist in Austin.
The Centuries
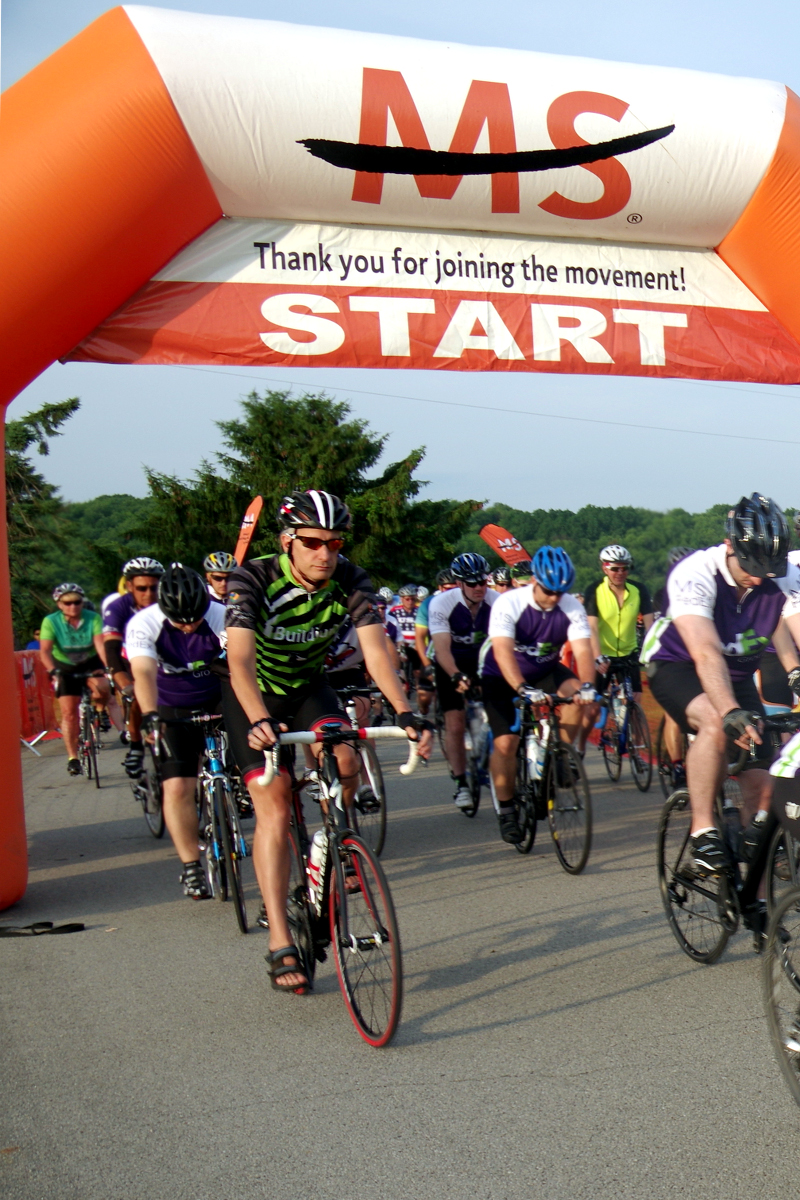
 Big turnout at the start of the Red Poppy Ride, my first century of the year. |
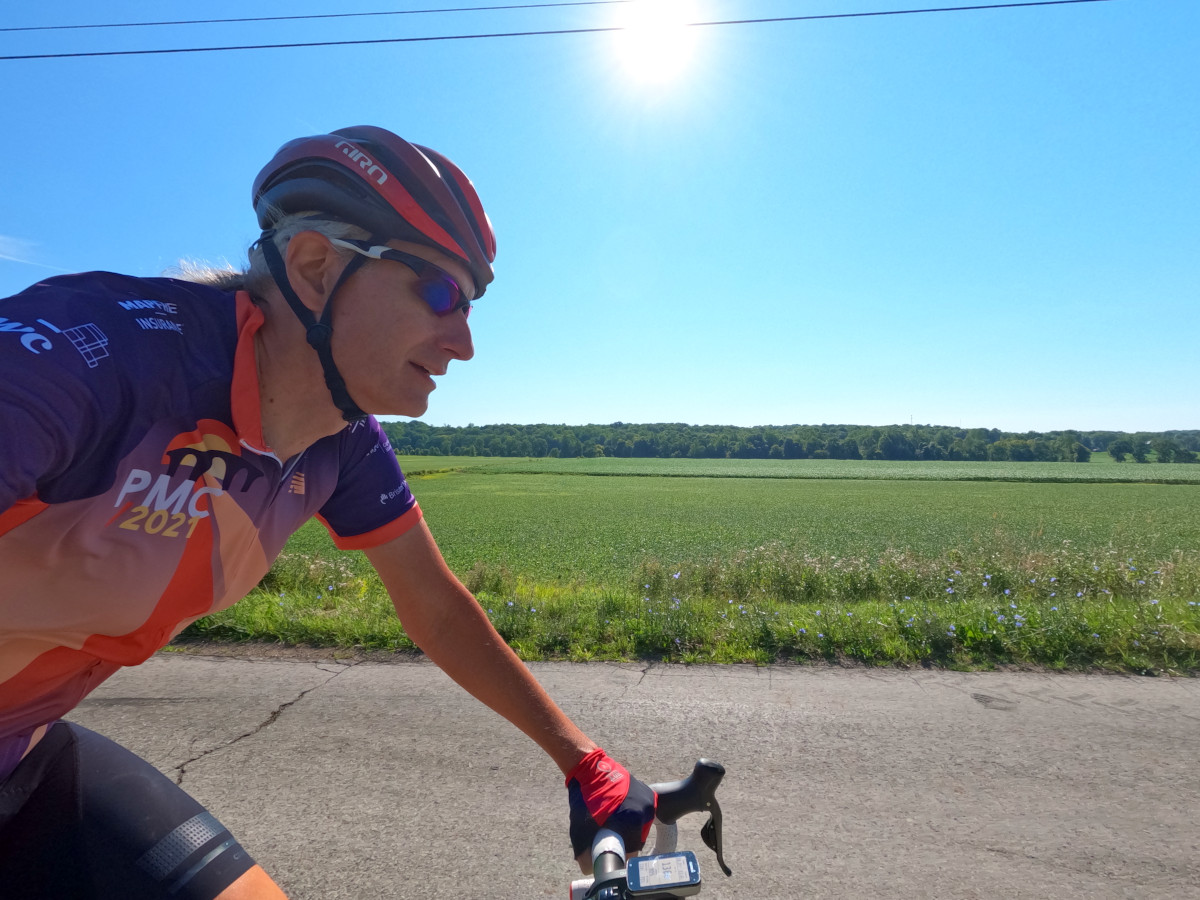
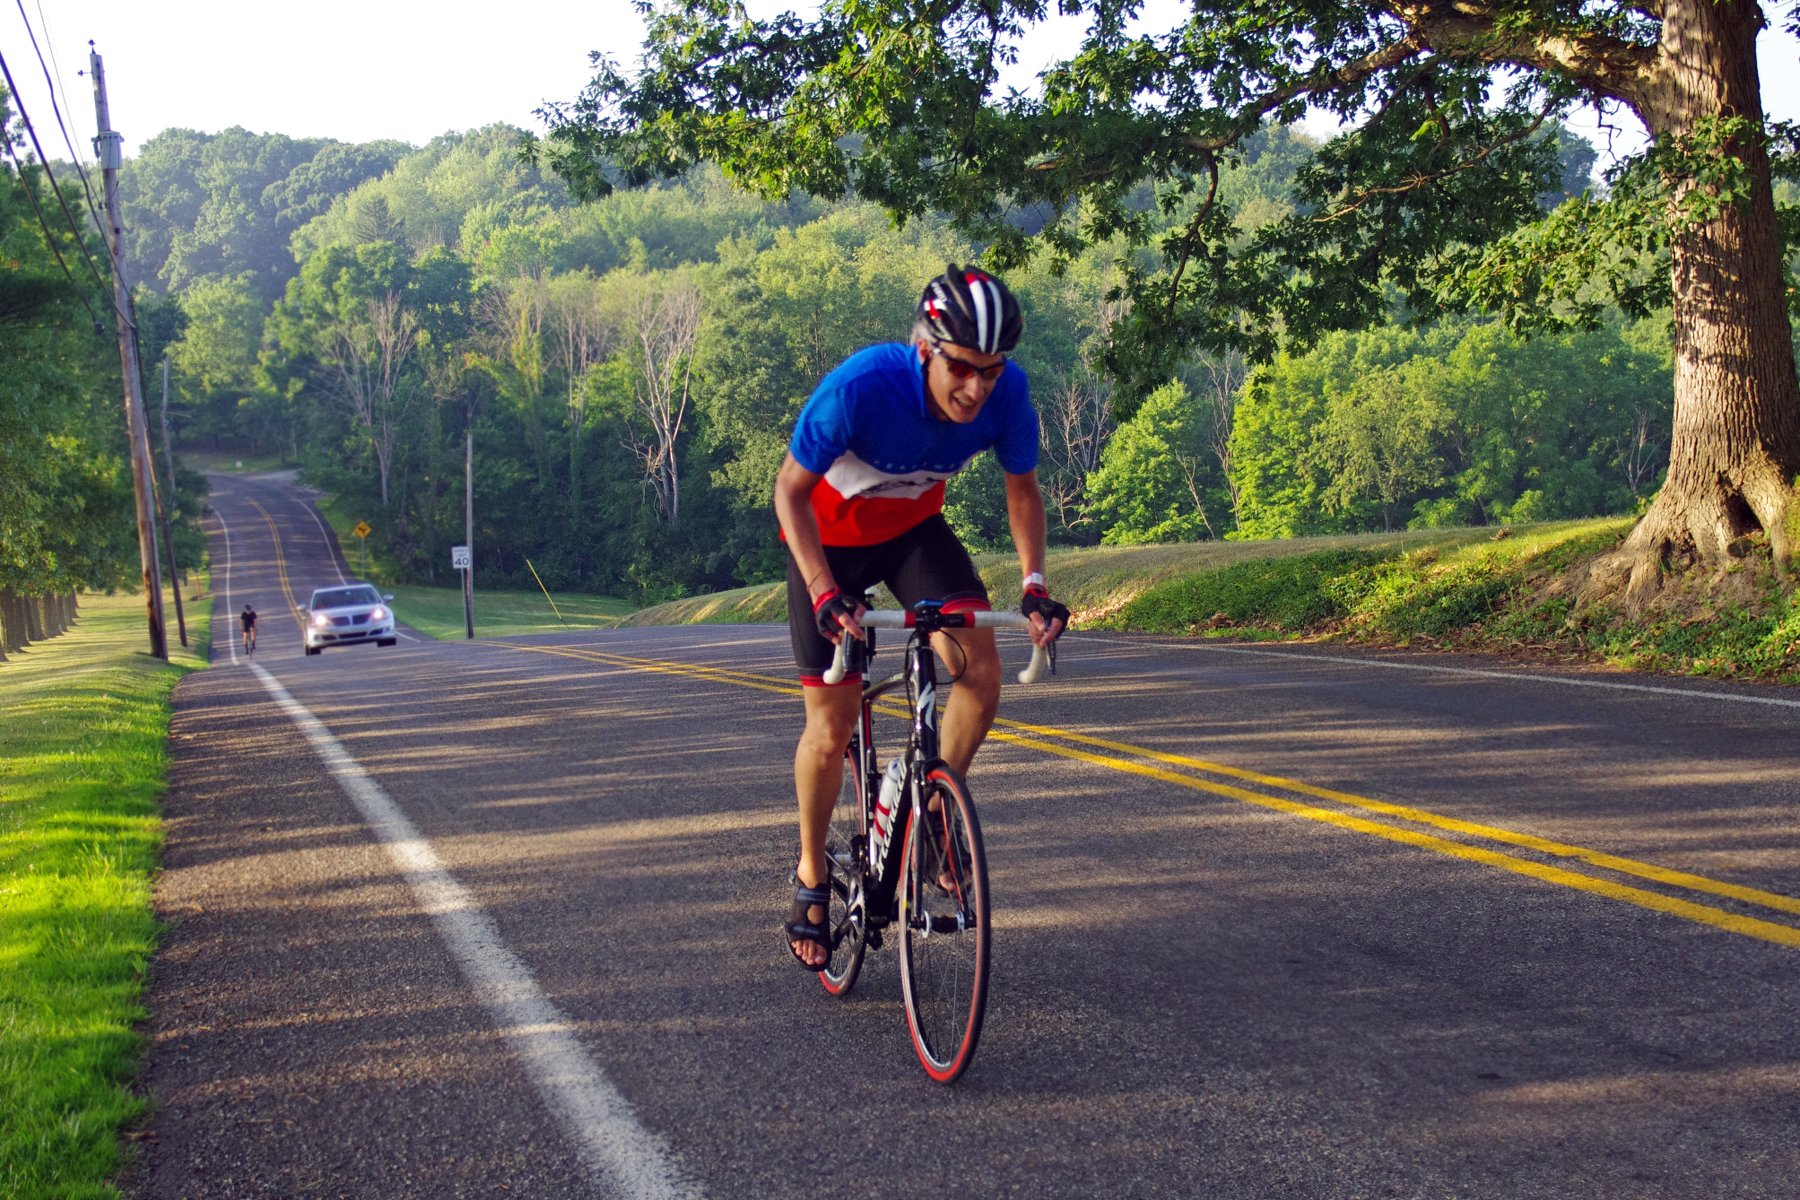
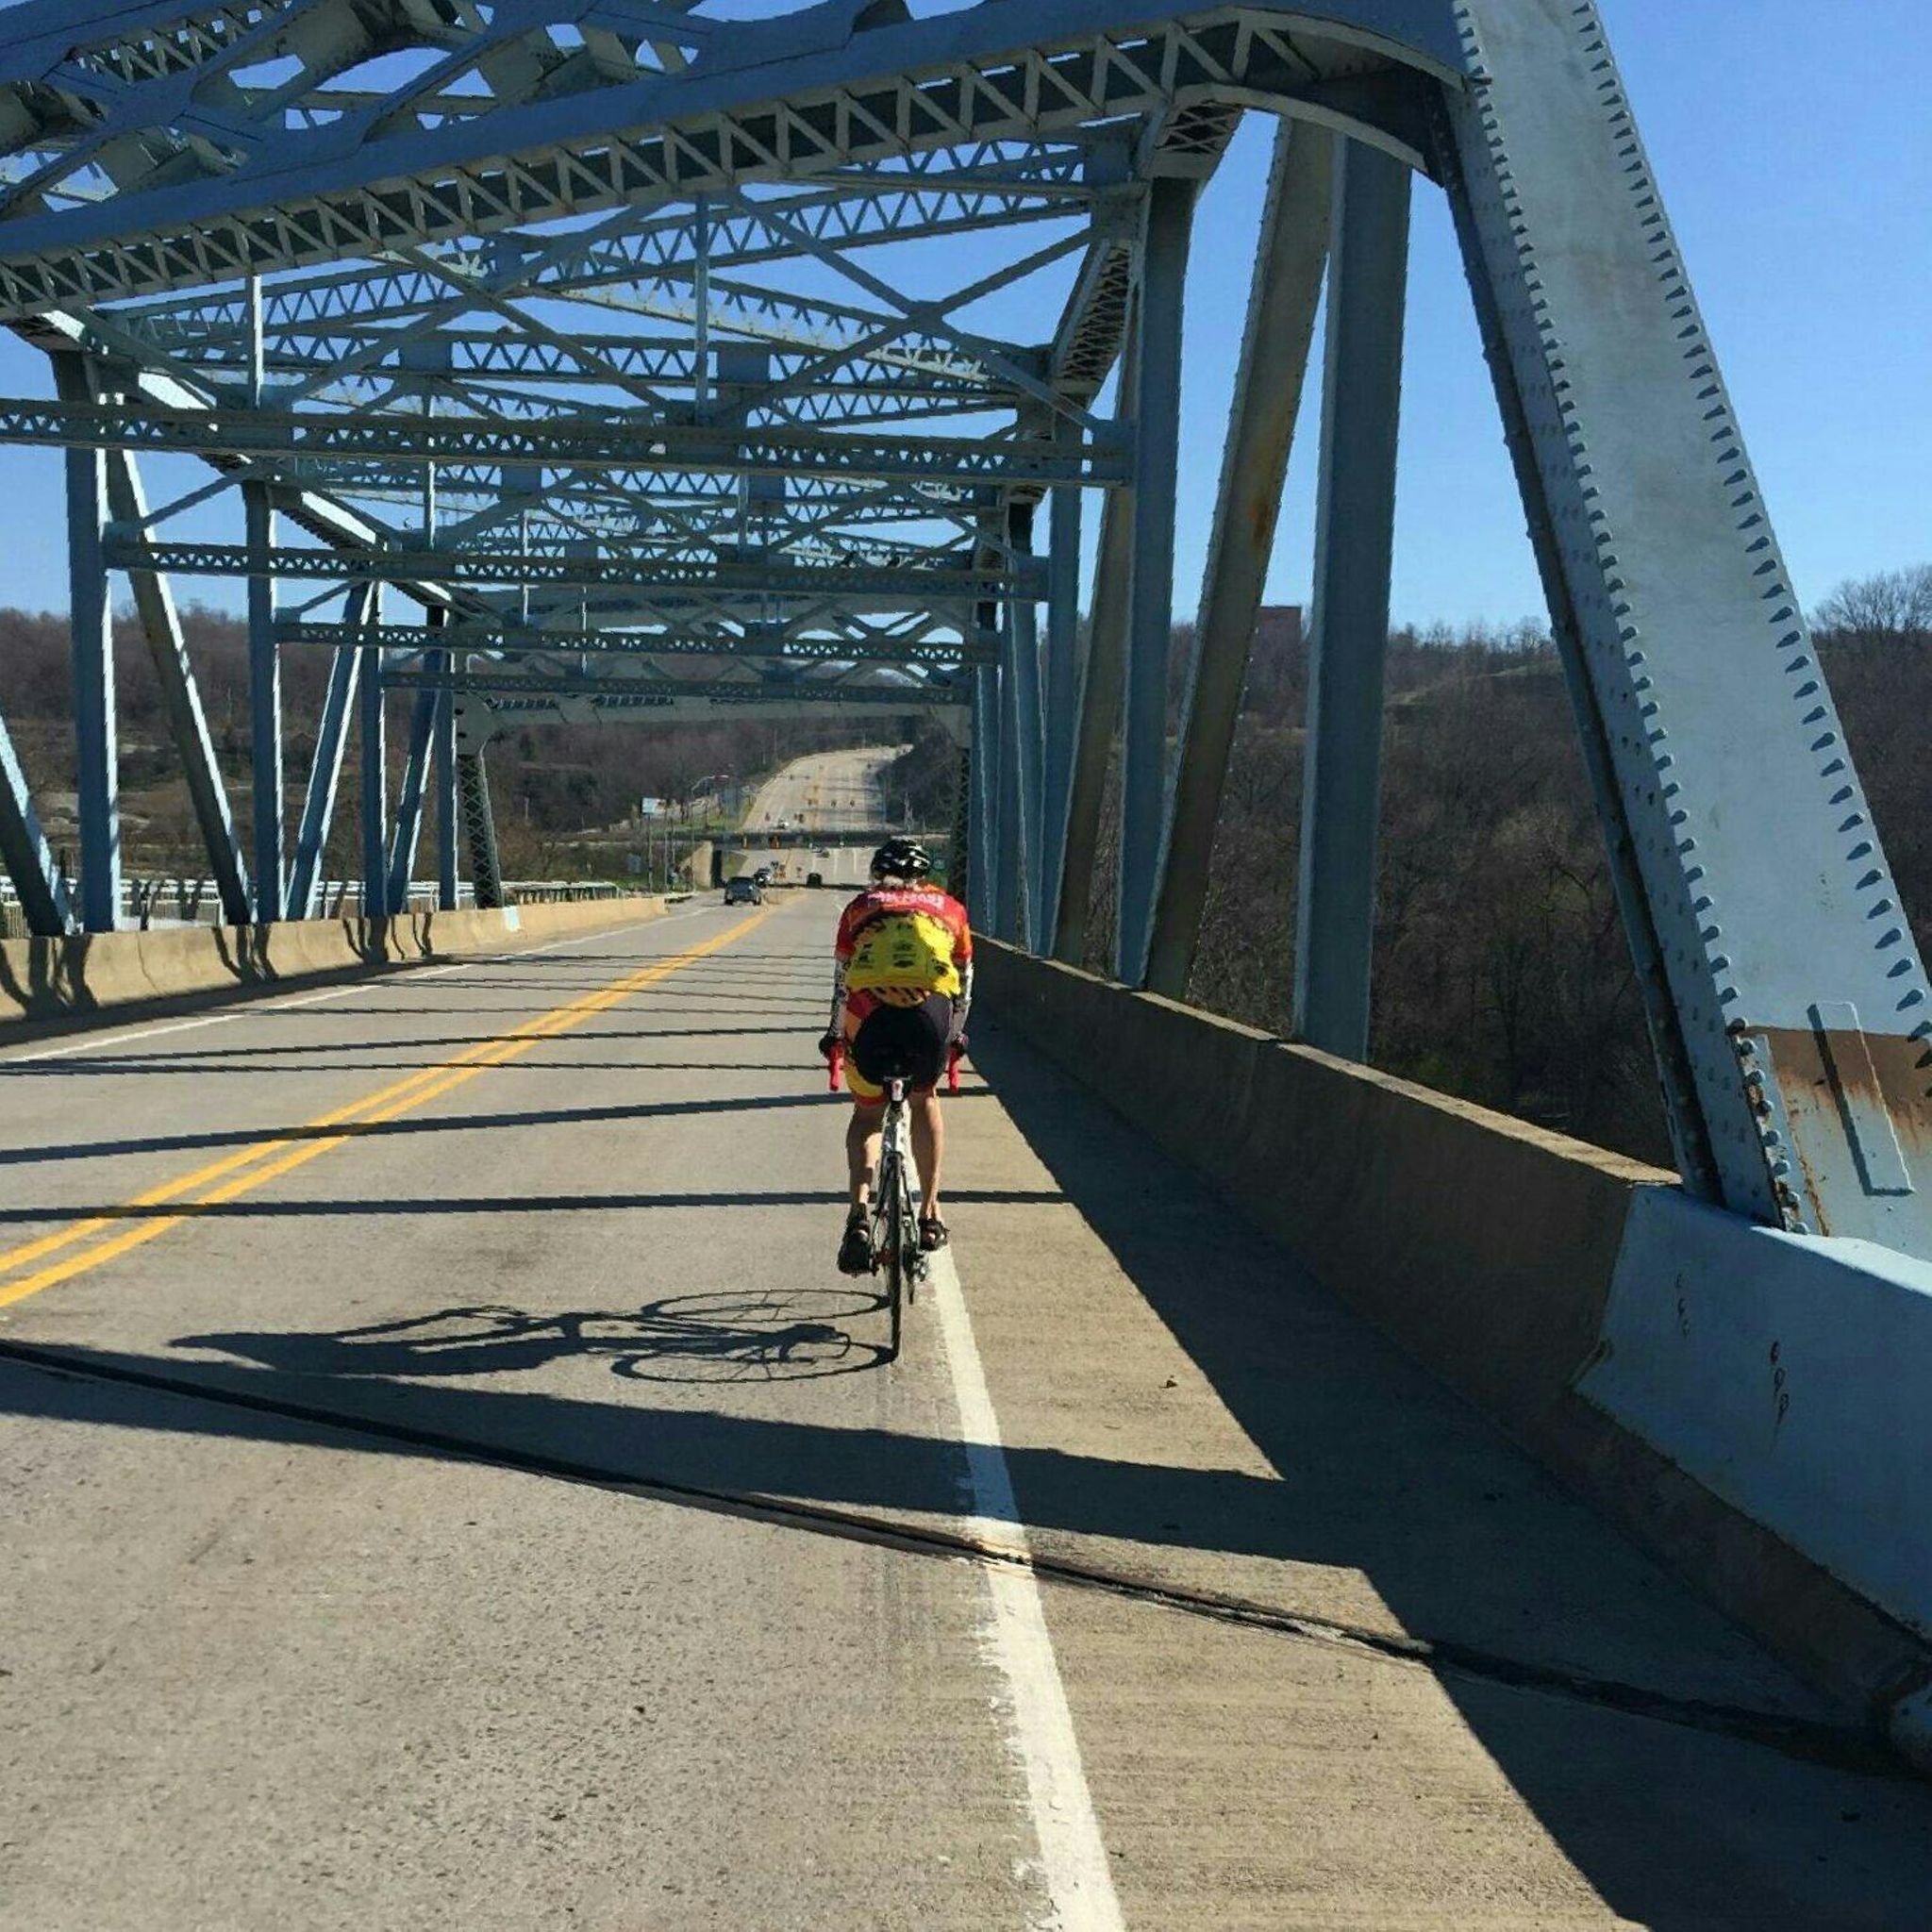
 Early morning haul down Lime Creek Road toward Volente on my 2024 Pan-Mass Challenge century. |
All I can say is that two is better than one. After one lone imperial century in 2023, I was eagerly planning for Livestrong to bring my 2024 tally to three, but greater concerns intervened. But the two I did complete were:
5/11: Red Poppy Ride
Although marred by a flat tire and criminally bad route markings, this was a delightful return to long-distance riding, and a big relief after the bad experience I had on the 2023 Livestrong Challenge (blogpo). But this ride’s challenges still prompted me to invest in new tire levers and a tire jack.
8/3: Remote PMC Day 1 Century
I’ve already covered this above, but my 110th century and 18th PMC was the biggest high point of my year.
It’s still a little premature to say for sure, but it’s worth mentioning: considering my age and health issues, it’s possible this was the last imperial century that I will ever ride.
Noteworthy Purchases
This year’s spending report falls into two main categories: a ton of mostly minor maintenance stuff, and not one but two automated selfie camera drones.
The first of those drones – the HoverAir X1 – created the entire category of selfie drones, and would have been the best purchase of the year on its own, after giving me the ability to take pretty decent video footage of myself while riding.
But later in the year they released the X1 PRO, which took the groundwork laid by the X1 and improved upon it immensely. I’ll spare you the details, and instead point you to my Gear of the Year blogpost for a full writeup. But in summary, it’s a fantastic piece of equipment that I hope to make even more use of in the upcoming year.
Here’s a two-minute compilation video I made that only uses footage from the original X1. Starting next year perhaps I’ll add a new section to my year-in-review post for an annual cycling highlight video!
Beyond that, my purchases were all pretty regular stuff.
In terms of new kit, I got a new cycling jersey for riding the 2024 Pan-Mass Challenge, and ordered three sets of PMC-branded fingerless gloves. As a team rider, I also purchased a 2024 Team Kermit jersey, and received a couple PMC-branded insulated (non-cycling) water bottles that our team captain had surplused from the ride organizers.
After struggling with hydration on last year’s Livestrong ride, I picked up a bottle of SaltStick electrolyte gelcaps. I’d used them back in Massachusetts in 2010 for cramping, but hadn’t noticed any obvious benefit; however, I was willing to give them another shot in order to help me deal with Texas’ heat. Results continue to be inconclusive.
Routine maintenance included buying inner tubes, CO2 canisters, a new tire, a replacement saddle bag, helmet padding inserts, and a new heart rate monitor. Also had to replace a battery cover on my Garmin power meter pedals, which I’d over-tightened and had to destroy to get into. And I got a new electric shaver (for the legs, of course).
In hopes of alleviating some of my tire-changing worries, I replaced my Park Tool tire levers with ones from Pedro’s, and a funky tire-seating device called the Rehook Tyre Glider; but I actually didn’t get to test either of those, so I can’t say they were of any value. I also tried my hand at patching punctured inner tubes with vulcanizing glue patches, which was an almost universal failure.
So really, aside from the selfie drones, it was a pretty underwhelming year in terms of equipment.
Additional Highlights
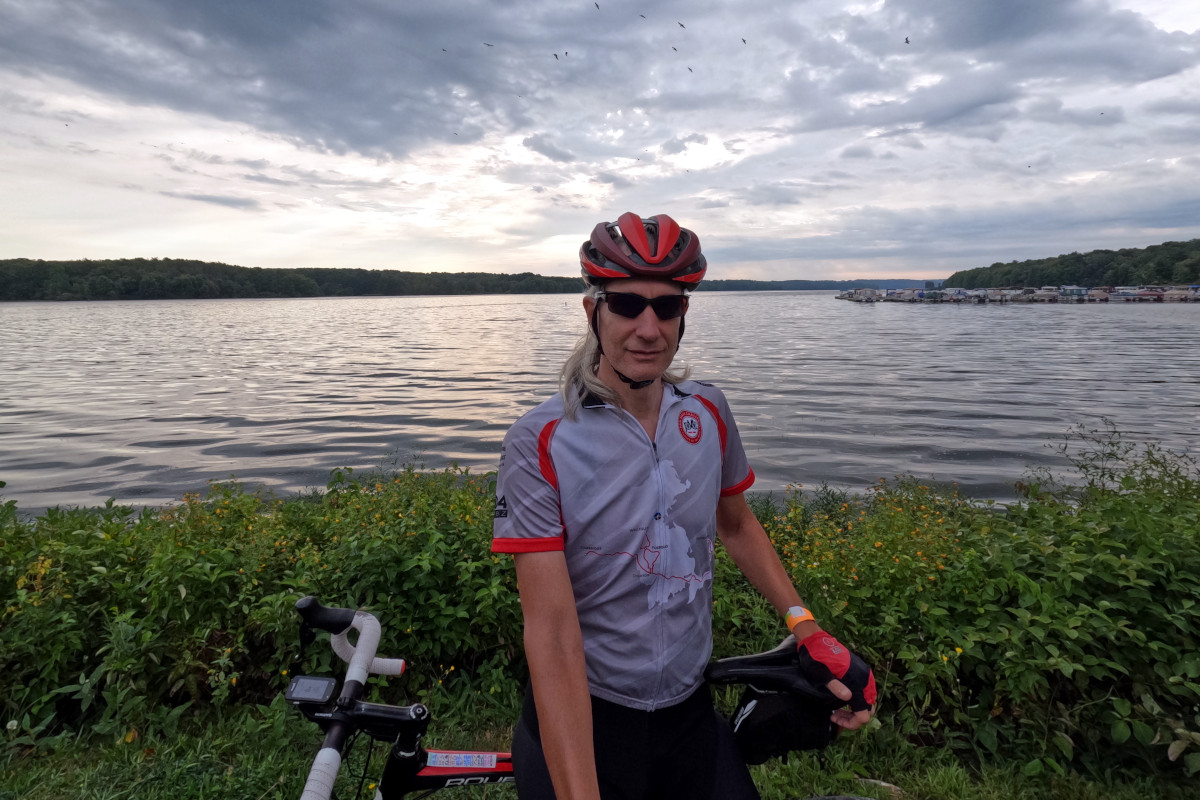
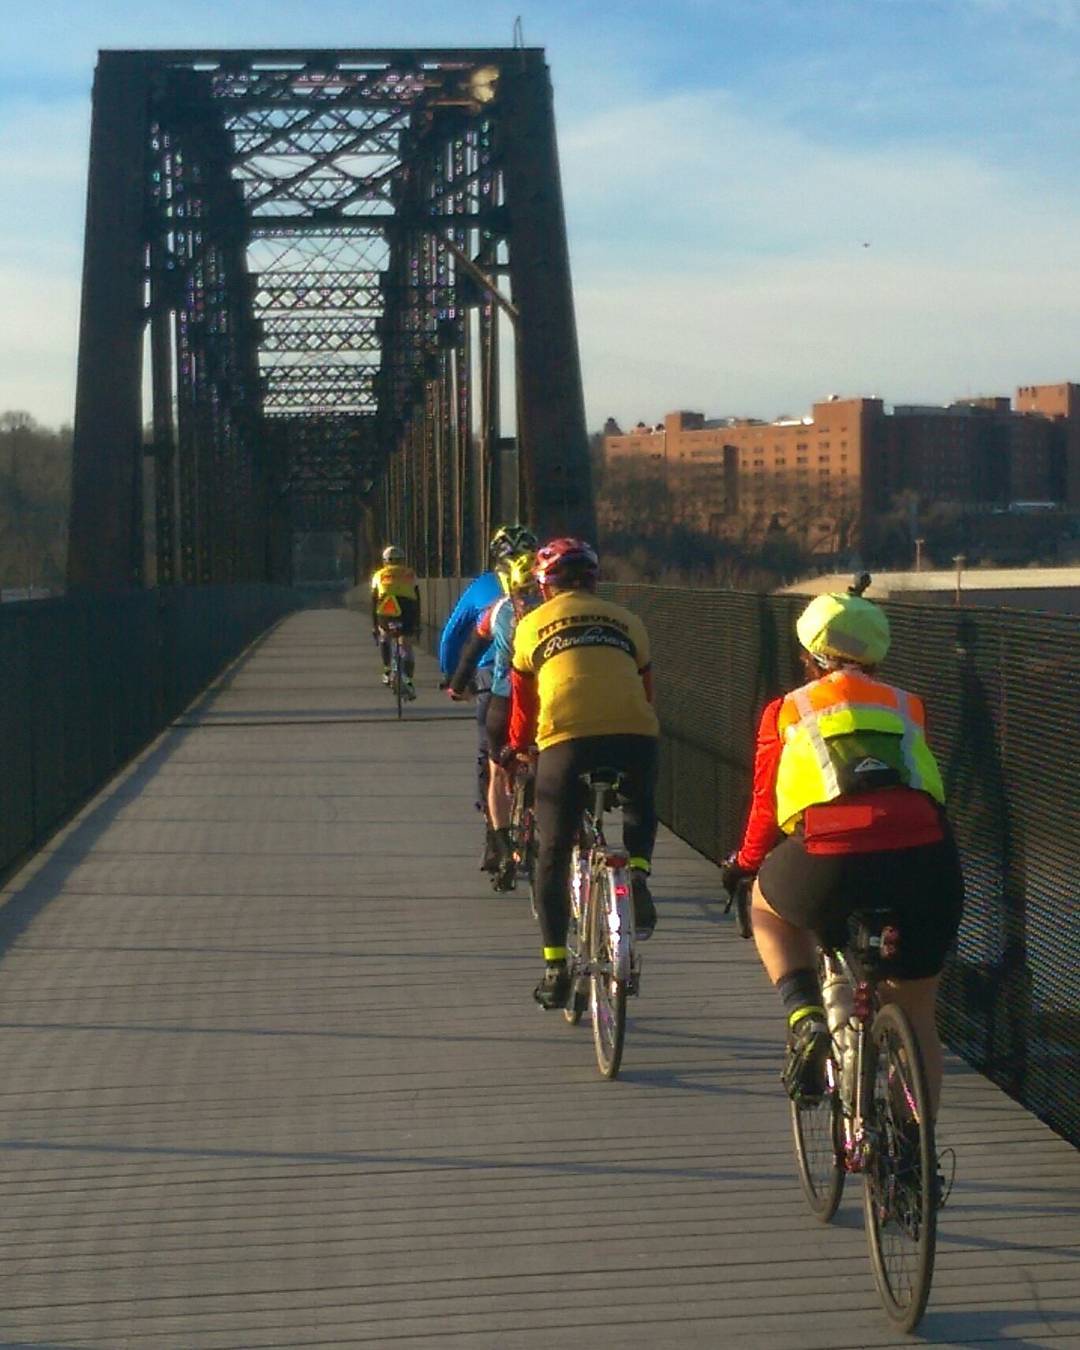
 Dramatic backdrop on the new Walnut Creek bike path extension to Manor during my PMC Day 2 ride. |
 A stunning sunset atop Turn 1 at the Circuit of the Americas F1 track. |
 Unlocked Level 80 on Zwift’s indoor trainer platform. |
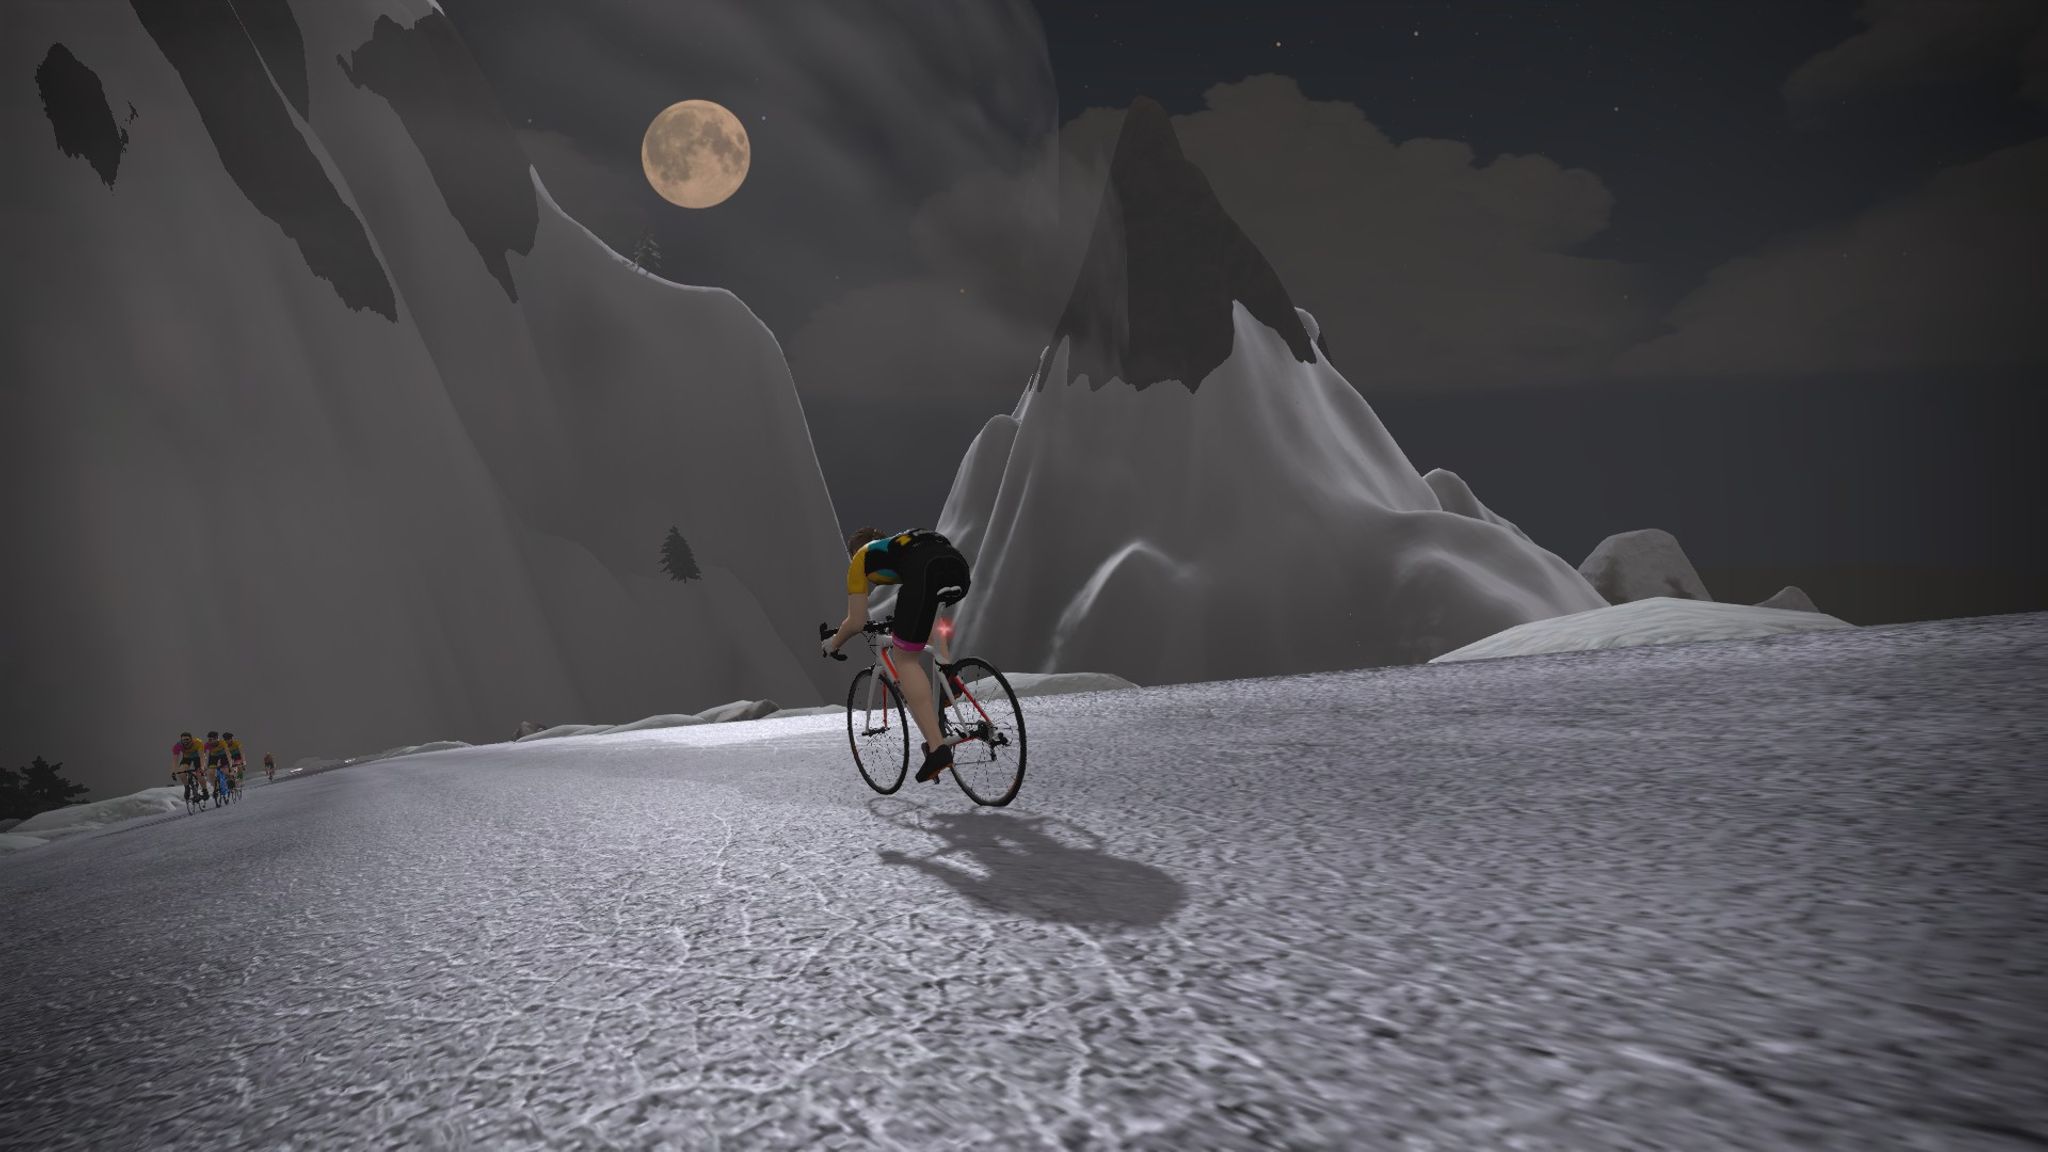
 Proved there was no drop in my FTP after my stroke on Zwift’s new “The Grade” hill climb. |
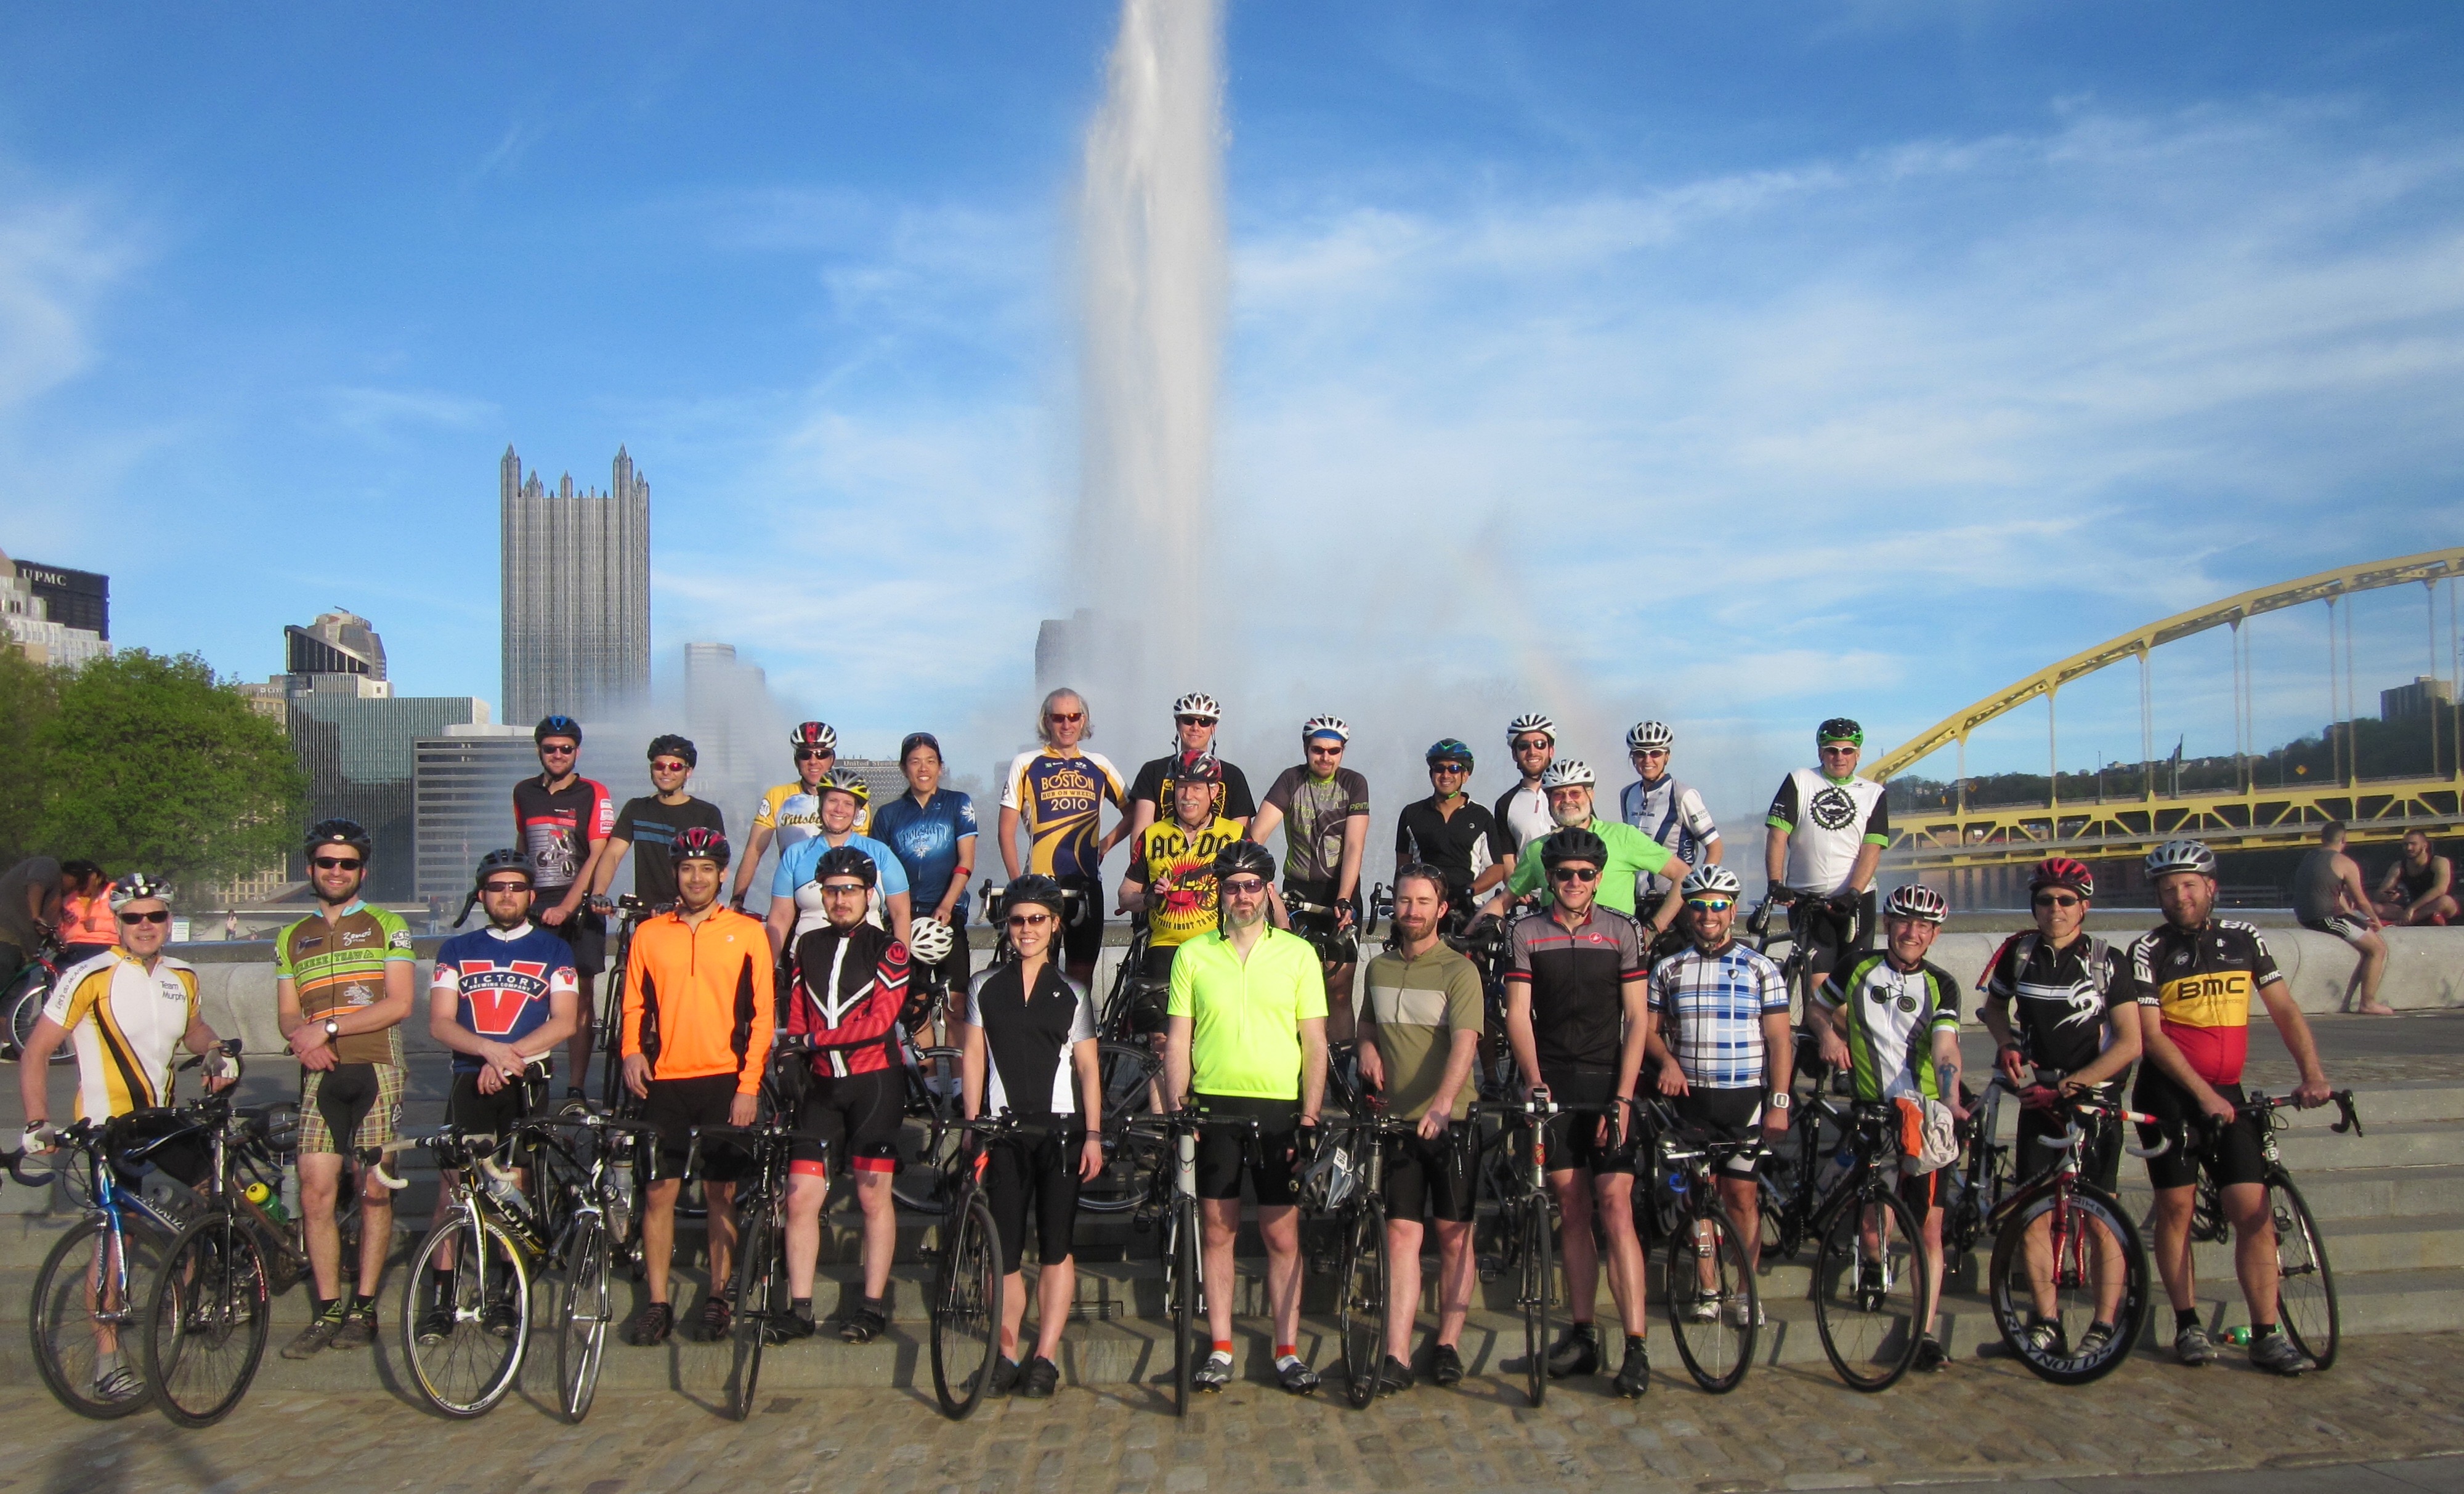
 Team Kermit group photo at the finish line of the 2024 Livestrong Challenge. |
Obviously, the highest-impact unplanned event of the year was my stroke, and starting my cycling life over from scratch. So far, my recovery seems near complete, even though I’ve kept my focus strictly on the indoor trainer so far. And I also recovered from my first bout of COVID in July.
But before my stroke, there were still some nice surprises. The Southern Walnut Creek trail was extended another nine kilometers to the town of Manor, which could serve as a gateway for rides farther to the northeast of Austin. And I made two trips down to the Circuit of the Americas Formula 1 track for Bike Nights, which is the same number of sessions I made in 2023. Sadly, illness forced me to miss their first actual post-sunset “under the lights” night ride.
Life on the indoor trainer was eventful. My Kickr CORE smart trainer got its first firmware updates in 2½ years, adding automatic calibration, which is a nice convenience. I also picked up Zwift Play handlebar-mounted controllers, which provide several convenient functions, including virtual shifting (which I disliked) and in-game steering.
Within Zwift’s virtual world, I began the year at Level 62 and finished at Level 81, although after four poorly-conceived redesigns, they’ve botched the XP system so horribly that levels just don’t mean that much anymore. In addition to an updated heads-up display, Zwift introduced a couple dozen new routes, including two small but noteworthy expansions: The Grade, a hilly section which features a short-form FTP test; and an updated copy of Zwift’s original 8 km Jarvis Island loop. So it took some work for me to reinstate my “Route Hero” status. And after having avoided the initial hoopla, I finally checked out Zwift’s Climb Portal, and had the pleasure of riding up Mt. Fuji while that route was featured back in May. Four years later, I’m still waiting for Zwift to bring it to their permanent Japan-inspired Makuri map.
But I have to call out two of my formerly-favorite vendors, who made stupid, user-hostile decisions that have me seriously reconsidering doing business with them.
Garmin Screws Its Users
I’ve been using Garmin’s portable GPS units to plan routes and record rides since 2000, using the original yellow eTrex, the eTrex Vista, the bike-specific Edge 800 and Edge 820, and about 18 months ago I picked up their newest bike computer, the Edge 840 Solar, which I reviewed here.
For the past two and a half decades, when you connected a Garmin GPS to your computer, it would appear as a disk drive that you could interact with just like any other: copying and moving files on and off the unit as desired. It was incredibly convenient, and one of my top criteria when evaluating bike GPS units.
However, a December update disabled disk access in favor of MTP, simulating an Android device that the user cannot interact with directly.
This is an immense pain in the ass for me. I have automated programs that rely on disk access to automatically save copies of my logs after every activity I complete. Furthermore, I use disk access to backup all my user data, settings, and key system files quarterly. Garmin’s change means there is no way for my programs to read anything on the device, or for me to manually copy files from it.
So far I’ve been able to decline installing the update that does this, but that also means forgoing all future fixes and enhancements. There are shareware programs that give some limited access to MTP volumes, but they’ll never be as scriptable as the simple file system disk interface.
As I said, being able to programmatically read files from the unit is one of my most important criteria when buying a bike GPS. If Garmin is no longer going to support that, it forces this longtime Garmin user to very seriously consider moving to their competitors.
Strava Screws Its Users
Despite being the incumbent athletic social network, Strava has a long history of lack of innovation and user-hostility. But this year they’ve shown a newfound ability to screw their customers.
First, there was their amateurish handling of a substantial price increase, which was never publicly announced and varied pricing dramatically by country.
Next, Strava alienated or outright forbade the API-based applications that most athletes rely on. By prohibiting third-party applications from showing one user’s data to anyone but that user, they immediately destroyed a whole ecosystem of communities that rely on their data, including athlete coaching, athlete leaderboards, and the ability to sync Strava data with other platforms. Strava has stupidly banned the very apps that make it useful to its customers!
Finally, in another completely unannounced change, Strava stepped up its effort to get rid of spammers. But in typical Strava fashion, they completely botched it. Instead of using technology to identify problematic users, they simply decided one day to ban every Strava user from using URLs. Suddenly overnight, and without any notice, any link posted in a user profile, an activity description, or a post simply disappeared, with no error message or notice. Worse yet, this was so poorly coded that even decimal numbers like “30.4 kilometers” were deleted for looking too much like those dreaded URLs!
This is all just so typical Strava, and it absolutely underscores the company’s completely user-hostile orientation. Needless to say, I’m unlikely to renew my paid subscription when it comes up for renewal next spring.
Blogposts
In recent years, I’ve had less to say in blog form, and loaded more of those things into my usual ride reports or my annual year in review. But here’s this year’s inventory:
Goals for 2025
 Ornoth’s 2024 cycling calendar/log |
 My 2024 Strava Year in Sport summary |
For the past few years, this section could have been shortened to just “more of the same”. I wish I could say the same again for 2025, but my life as a cyclist has changed at a fundamental level, forcing a complete reset in my expectations. So we start with my most basic and important goal:
Stroke & Cardiac Recovery
While the symptoms of my stroke have long passed, the followup continues, with several hematology and cardiology visits planned.
I have two more months of relative normailty, but then I will have cardiac surgery to repair a hole between my atria, and will be under doctor’s orders for absolutely zero exercise for all of March and into April.
Once I’m cleared to exercise again, cycling life will start from scratch all over again, while I first test whether I’m okay to ride, then rebuild some fitness, and finally test my endurance and learn what demands my body will still be capable of meeting.
My questions won’t have changed much since I came home from the hospital: Will I be able to participate in group rides? Can I still do a metric century? An imperial? Will I be able to trust my body again? Can I ever return to what used to be “normal”?
My 19th Pan-Mass Challenge?
Sadly, the PMC is once again a big question mark. While I really want to do it, I won’t have any idea what’s physically achievable until May, at earliest.
Even if I were in perfect health, there are still a lot of questions up in the air. Would I try to simulate the full 2-day, 300 km route? Would I still do it in August, or perhaps choose a different time? Would I ride as a member of Team Kermit or return to being a solo rider? And will I have time and energy to fundraise?
Like everything else, I won’t have any way to answer these questions until I get through my upcoming heart surgery.
More, Better Videos!
Whatever riding I do, I hope to capture it with the newer, more capable HoverAir X1 PRO autonomous selfie drone. With video quality, subject tracking, and speed all improved, I’m excited to see what I’ll be able to do with it, and equally excited to share the results with you in this cycling blog and on my Strava feed.
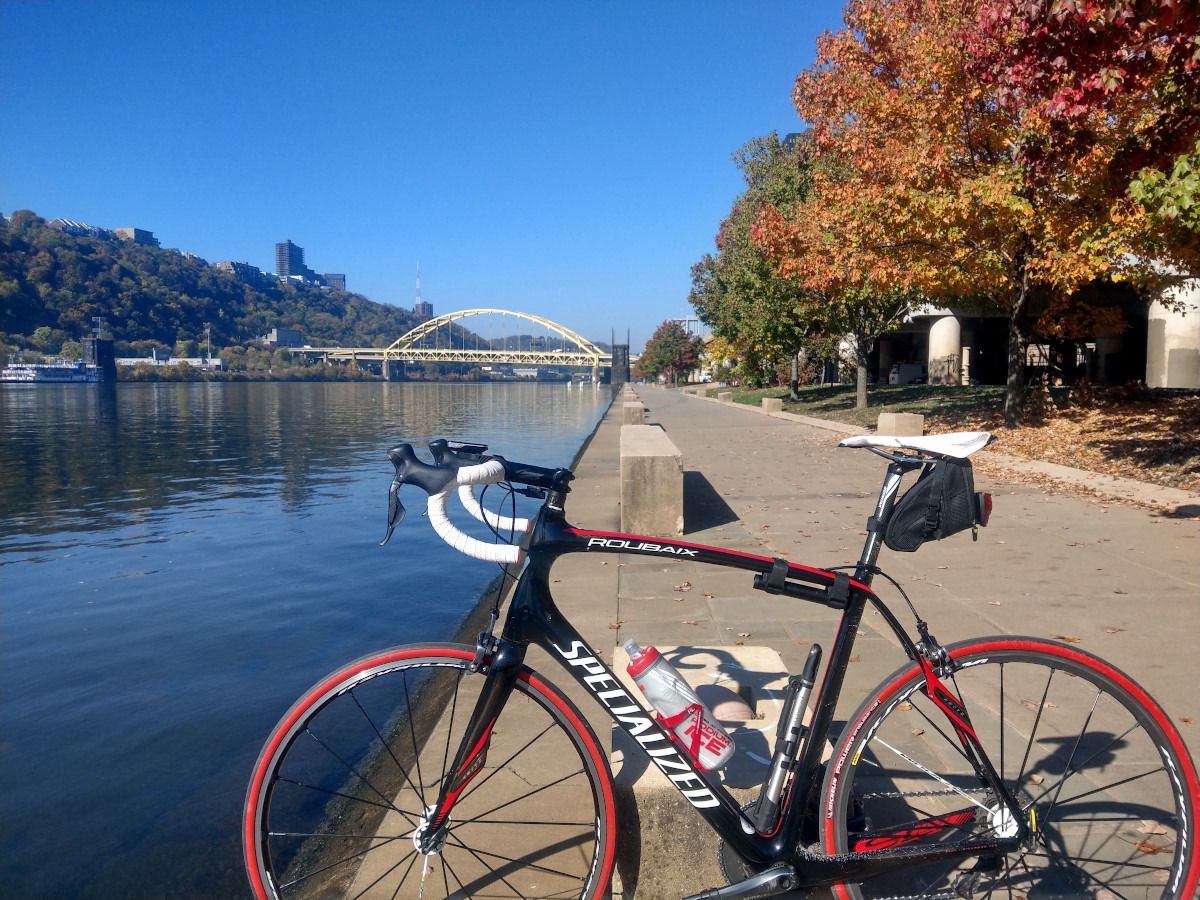
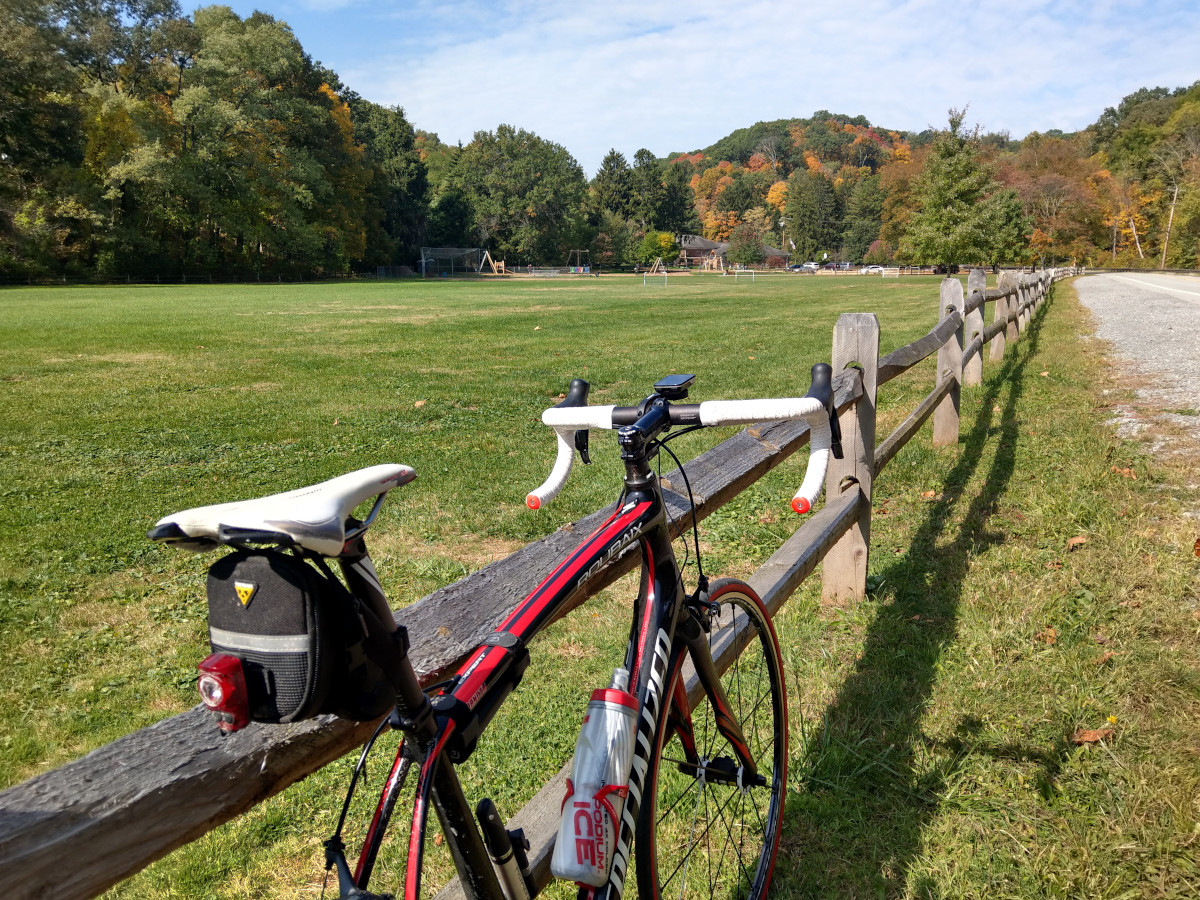
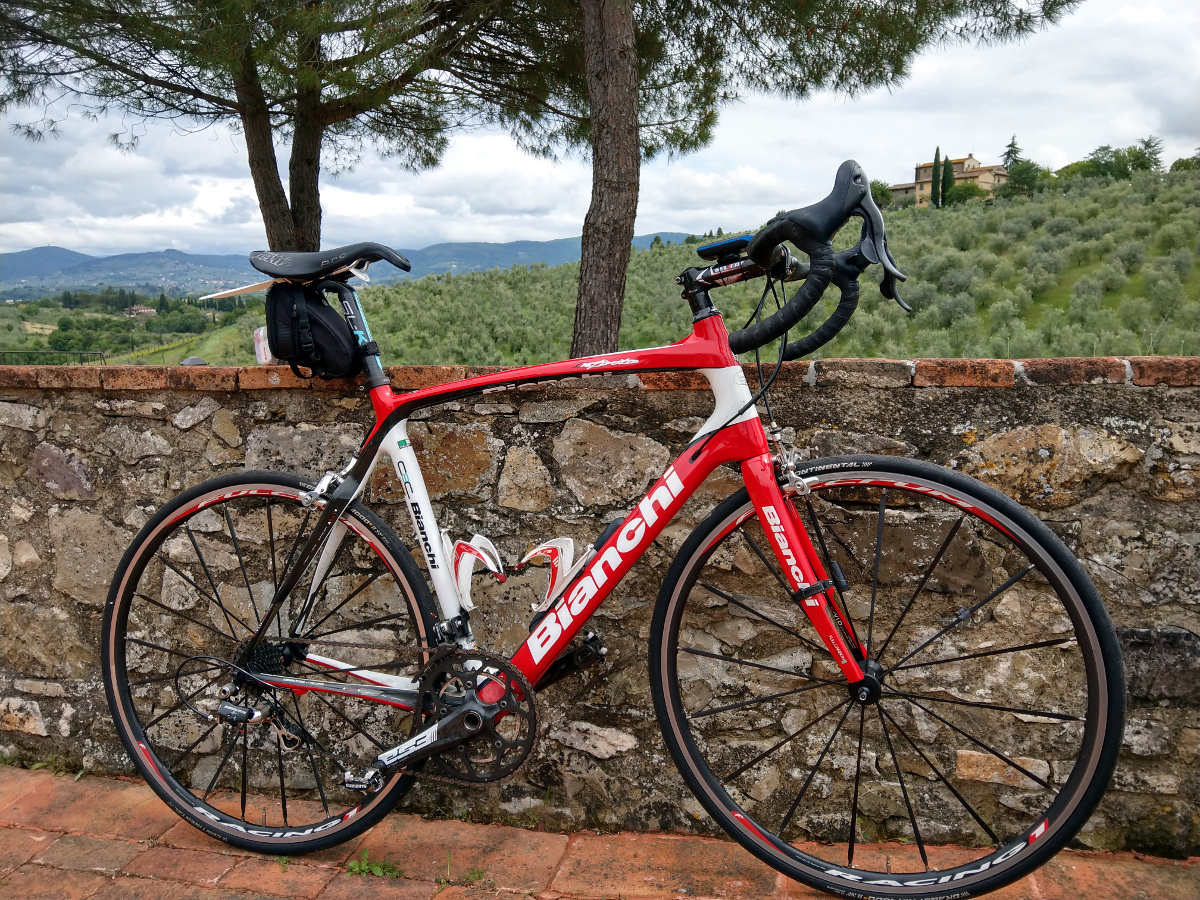
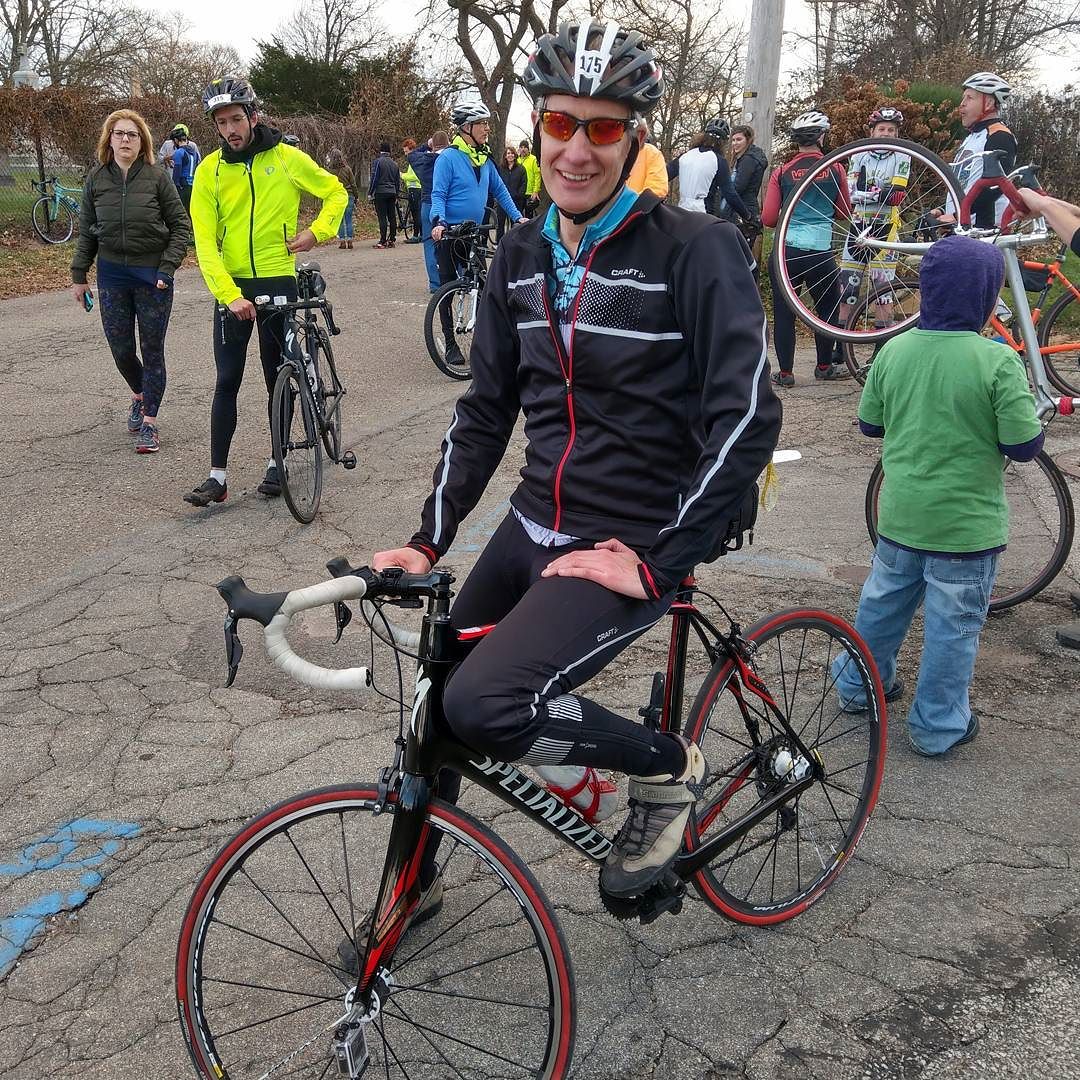
 My trusty steed waits, ready for another summer in the Texas sun. |
Some Anticipated Purchases
Having spent the past three months on the indoor trainer, I’ve been sitting on a few ideas for next year’s cycling upgrades, including the following:
On the bike: After two years and almost 18,000 kilometers, my bike could probably benefit from its first thorough tune-up. And some new bar tape.
Cycling kit: Although my current ones are only 18 months old, I could probably use a couple new pairs of bibshorts. And my Shimano cycling sandals really need to be replaced.
As for tires: I’m really tired of struggling to get my Conti GP5000 tires mounted on my tubeless-ready rims, so when they wear out, I’m going to replace them with Pirelli P-Zero tires and see how that goes. And I’m perpetually on the fence about whether I should try running lighter and higher-performance latex or TPU inner tubes, instead of the much more convenient and economical default latex. Maybe next year we’ll give those a shot; just don’t expect to ever see me going tubeless!
Conclusion
2024 started well, but ended on a sour note. The high points that I’ll remember include a very successful first solo Austin PMC ride, and the purchase and videos captured with my first autonomous selfie drone.
But by far the most defining moment of the past year was my stroke. It was a miracle that I came away from it without any significant loss of function, but also a very grim reminder that one’s time is limited, and life can disappear in any instant. And my upcoming cardiac work casts an immense shadow onto 2025 and beyond.
It’s hard to get past that realization and return to making plans and setting goals as if nothing had changed.
And at the same time, it underscores how precious every day – and every ride – is, how big a blessing it is simply to be able to get out, travel around under our own power, and experience nature and the world around us.
That’s the attitude I’ll try to bring with me on every precious ride this year as I deal with my surgery, then try to recover enough to resume outdoor riding.
Happy 2025 to everyone I share these roads with!


